Virgin Media 2011 Annual Report Download - page 105
Download and view the complete annual report
Please find page 105 of the 2011 Virgin Media annual report below. You can navigate through the pages in the report by either clicking on the pages listed below, or by using the keyword search tool below to find specific information within the annual report.-
 1
1 -
2
-
3
-
4
-
5
-
6
-
7
-
8
-
9
-
10
-
11
-
12
-
13
-
14
-
15
-
16
-
17
-
18
-
19
-
20
-
21
-
22
-
23
-
24
-
25
-
26
-
27
-
28
-
29
-
30
-
31
-
32
-
33
-
34
-
35
-
36
-
37
-
38
-
39
-
40
-
41
-
42
-
43
-
44
-
45
-
46
-
47
-
48
-
49
-
50
-
51
-
52
-
53
-
54
-
55
-
56
-
57
-
58
-
59
-
60
-
61
-
62
-
63
-
64
-
65
-
66
-
67
-
68
-
69
-
70
-
71
-
72
-
73
-
74
-
75
-
76
-
77
-
78
-
79
-
80
-
81
-
82
-
83
-
84
-
85
-
86
-
87
-
88
-
89
-
90
-
91
-
92
-
93
-
94
-
 95
95 -
 96
96 -
 97
97 -
 98
98 -
 99
99 -
 100
100 -
 101
101 -
 102
102 -
 103
103 -
 104
104 -
 105
105 -
 106
106 -
 107
107 -
 108
108 -
 109
109 -
 110
110 -
 111
111 -
 112
112 -
 113
113 -
 114
114 -
 115
115 -
116
-
117
-
118
-
119
-
120
-
121
-
122
-
123
-
124
-
125
-
126
-
127
-
128
-
129
-
130
-
131
-
132
-
133
-
134
-
135
-
136
-
137
-
138
-
139
-
140
-
141
-
142
-
143
-
144
-
145
-
146
-
147
-
148
-
149
-
150
-
151
-
152
-
153
-
154
-
155
-
156
-
157
-
158
-
159
-
160
-
161
-
162
-
163
-
164
-
165
-
166
-
167
-
168
-
169
-
170
-
171
-
172
-
173
-
174
-
175
-
176
-
177
-
178
-
179
-
180
-
181
-
182
-
183
-
184
-
185
-
186
-
187
-
188
-
189
-
190
-
191
-
192
-
193
-
194
-
195
-
196
-
197
-
198
-
199
-
200
-
201
-
202
-
203
-
204
-
205
-
206
-
207
-
208
-
209
-
210
-
211
-
212
-
213
-
214
-
215
-
216
-
217
-
218
 |
 |

VIRGIN MEDIA INC. AND SUBSIDIARIES
NOTES TO CONSOLIDATED FINANCIAL STATEMENTS (continued)
Note 3—Earnings Per Share
Basic net income (loss) per common share and basic income (loss) from continuing operations per share is
computed by dividing the net income (loss) and income (loss) from continuing operations, respectively, for the
years ended December 31, 2011, 2010 and 2009 by the weighted average number of shares outstanding during
the respective periods. Diluted net income (loss) per common share and diluted income (loss) from continuing
operations per common share is computed on the basis of the weighted average number of shares of common
stock plus the effect of dilutive potential common shares outstanding during the period using the treasury stock
method for options, sharesave options, shares of restricted stock held in escrow, restricted stock units and
warrants, and the if-converted method for shares potentially issuable under our convertible senior notes.
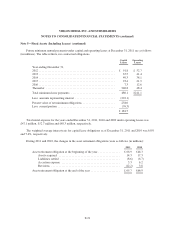
Basic and diluted income (loss) from discontinued operations per share for the years ended December 31,
2011, 2010 and 2009 was £0.00, £0.08 and £(0.02) respectively.
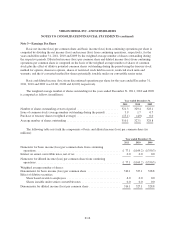
The weighted average number of shares outstanding for the years ended December 31, 2011, 2010 and 2009
is computed as follows (in millions):
Year ended December 31,
2011 2010 2009
Number of shares outstanding at start of period ............................ 321.3 329.4 328.1
Issue of common stock (average number outstanding during the period) ........ 3.9 1.7 0.7
Purchase of treasury shares (weighted average) ............................ (15.1) (4.0) 0.0
Average number of shares outstanding ................................... 310.1 327.1 328.8
The following table sets forth the components of basic and diluted income (loss) per common share (in
millions):
Year ended December 31,
2011 2010 2009
Numerator for basic income (loss) per common share from continuing
operations ......................................................... £ 77.1 £(169.2) £(350.3)
Interest on senior convertible notes, net of tax .............................. 0.0 0.0 0.0
Numerator for diluted income (loss) per common share from continuing
operations ......................................................... £ 77.1 £(169.2) £(350.3)
Weighted average number of shares:
Denominator for basic income (loss) per common share ...................... 310.1 327.1 328.8
Effect of dilutive securities:
Share based awards to employees .................................... 6.0 0.0 0.0
Shares issuable under senior convertible notes .......................... 0.0 0.0 0.0
Denominator for diluted income (loss) per common share ..................... 316.1 327.1 328.8
F-16