Virgin Media 2011 Annual Report Download - page 54
Download and view the complete annual report
Please find page 54 of the 2011 Virgin Media annual report below. You can navigate through the pages in the report by either clicking on the pages listed below, or by using the keyword search tool below to find specific information within the annual report.-
 1
1 -
2
-
3
-
4
-
5
-
6
-
7
-
8
-
9
-
10
-
11
-
12
-
13
-
14
-
15
-
16
-
17
-
18
-
19
-
20
-
21
-
22
-
23
-
24
-
25
-
26
-
27
-
28
-
29
-
30
-
31
-
32
-
33
-
34
-
35
-
36
-
37
-
38
-
39
-
40
-
41
-
42
-
43
-
 44
44 -
 45
45 -
 46
46 -
 47
47 -
 48
48 -
 49
49 -
 50
50 -
 51
51 -
 52
52 -
 53
53 -
 54
54 -
 55
55 -
 56
56 -
 57
57 -
 58
58 -
 59
59 -
 60
60 -
 61
61 -
 62
62 -
 63
63 -
 64
64 -
65
-
66
-
67
-
68
-
69
-
70
-
71
-
72
-
73
-
74
-
75
-
76
-
77
-
78
-
79
-
80
-
81
-
82
-
83
-
84
-
85
-
86
-
87
-
88
-
89
-
90
-
91
-
92
-
93
-
94
-
95
-
96
-
97
-
98
-
99
-
100
-
101
-
102
-
103
-
104
-
105
-
106
-
107
-
108
-
109
-
110
-
111
-
112
-
113
-
114
-
115
-
116
-
117
-
118
-
119
-
120
-
121
-
122
-
123
-
124
-
125
-
126
-
127
-
128
-
129
-
130
-
131
-
132
-
133
-
134
-
135
-
136
-
137
-
138
-
139
-
140
-
141
-
142
-
143
-
144
-
145
-
146
-
147
-
148
-
149
-
150
-
151
-
152
-
153
-
154
-
155
-
156
-
157
-
158
-
159
-
160
-
161
-
162
-
163
-
164
-
165
-
166
-
167
-
168
-
169
-
170
-
171
-
172
-
173
-
174
-
175
-
176
-
177
-
178
-
179
-
180
-
181
-
182
-
183
-
184
-
185
-
186
-
187
-
188
-
189
-
190
-
191
-
192
-
193
-
194
-
195
-
196
-
197
-
198
-
199
-
200
-
201
-
202
-
203
-
204
-
205
-
206
-
207
-
208
-
209
-
210
-
211
-
212
-
213
-
214
-
215
-
216
-
217
-
218
 |
 |

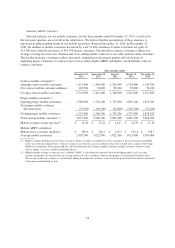
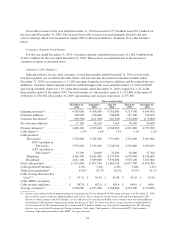
Summary Cable Statistics
Selected statistics for our cable customers, for the three months ended December 31, 2011 as well as the
four prior quarters, are set forth in the table below. We believe that the presentation of these statistics is
important in understanding trends in our cable operations. Our net customer movement for the three months
ended December 31, 2011 was an increase of 15,000 customers being the net of gross additions and
disconnections (net additions). Average monthly customer churn was 1.3% in the three months ended
December 31, 2011 and 2010. The total number of cable products grew to 11,998,700 at December 31, 2011
from 11,951,600 at December 31, 2010, representing a net increase in products of 47,100. Between
December 31, 2010 and December 31, 2011, the number of cable customers increased by 5,500.
Three months ended
December 31,
2011
September 30,
2011
June 30,
2011
March 31,
2011
December 31,
2010
Opening customers ............... 4,790,600 4,784,300 4,820,300 4,800,100 4,783,000
Customer additions ............... 203,100 243,700 169,800 191,800 206,600
Customer disconnections(1) ......... (188,100) (237,400) (205,800) (171,600) (189,500)
Net customer additions
(disconnections) ............... 15,000 6,300 (36,000) 20,200 17,100
Closing customers ................ 4,805,600 4,790,600 4,784,300 4,820,300 4,800,100
Cable churn(2) ................... 1.3% 1.7 %1.4 % 1.2 % 1.3 %
Cable products:
Television .................. 3,763,100 3,762,100 3,767,700 3,788,900 3,778,800
Telephone .................. 4,132,700 4,141,000 4,155,000 4,180,900 4,161,700
Broadband .................. 4,102,900 4,072,900 4,048,600 4,061,200 4,011,100
Total cable products .............. 11,998,700 11,976,000 11,971,300 12,031,000 11,951,600
Cable products/Customer .......... 2.50x 2.50x 2.50x 2.50x 2.49x
Triple-play penetration ............ 63.7 % 63.8% 63.8 % 63.4 % 63.0 %
Cable Average Revenue Per User(3) . . £ 47.85 £ 47.86 £ 47.35 £ 46.16 £ 47.51
Cable ARPU calculation:
Cable revenue (millions) ........... £ 688.5 £ 685.0 £ 682.3 £ 666.0 £ 682.8
Average customers ............... 4,796,900 4,771,500 4,802,600 4,809,000 4,790,000
(1) During the second half of 2010, we reviewed our credit and collections reporting processes and aligned the way we measure
disconnections with our underlying operational process. As a result, we estimate that reported gross disconnects decreased by 4,900
customers, representing 11,000 products, during the fourth quarter of 2010.
(2) Customer churn is calculated by taking the total disconnects during the month (excluding any data cleanse activity) and dividing them by
the average number of customers during the month. Average monthly churn during a quarter is the average of the three monthly churn
calculations within the quarter.
(3) The monthly cable average revenue per user, or cable ARPU, is calculated on a quarterly basis by dividing total revenue generated from
the provision of telephone, television and internet services to customers who are directly connected to our network in that period together
with revenue generated from our customers using our virginmedia.com website, exclusive of VAT, by the average number of customers
directly connected to our network in that period divided by three. The average number of customers is calculated by adding the number
of customers at the start of the quarter and at the end of each month of the quarter and dividing by four.
53