Virgin Media 2011 Annual Report Download - page 139
Download and view the complete annual report
Please find page 139 of the 2011 Virgin Media annual report below. You can navigate through the pages in the report by either clicking on the pages listed below, or by using the keyword search tool below to find specific information within the annual report.-
 1
1 -
2
-
3
-
4
-
5
-
6
-
7
-
8
-
9
-
10
-
11
-
12
-
13
-
14
-
15
-
16
-
17
-
18
-
19
-
20
-
21
-
22
-
23
-
24
-
25
-
26
-
27
-
28
-
29
-
30
-
31
-
32
-
33
-
34
-
35
-
36
-
37
-
38
-
39
-
40
-
41
-
42
-
43
-
44
-
45
-
46
-
47
-
48
-
49
-
50
-
51
-
52
-
53
-
54
-
55
-
56
-
57
-
58
-
59
-
60
-
61
-
62
-
63
-
64
-
65
-
66
-
67
-
68
-
69
-
70
-
71
-
72
-
73
-
74
-
75
-
76
-
77
-
78
-
79
-
80
-
81
-
82
-
83
-
84
-
85
-
86
-
87
-
88
-
89
-
90
-
91
-
92
-
93
-
94
-
95
-
96
-
97
-
98
-
99
-
100
-
101
-
102
-
103
-
104
-
105
-
106
-
107
-
108
-
109
-
110
-
111
-
112
-
113
-
114
-
115
-
116
-
117
-
118
-
119
-
120
-
121
-
122
-
123
-
124
-
125
-
126
-
127
-
128
-
 129
129 -
 130
130 -
 131
131 -
 132
132 -
 133
133 -
 134
134 -
 135
135 -
 136
136 -
 137
137 -
 138
138 -
 139
139 -
 140
140 -
 141
141 -
 142
142 -
 143
143 -
 144
144 -
 145
145 -
 146
146 -
 147
147 -
 148
148 -
 149
149 -
150
-
151
-
152
-
153
-
154
-
155
-
156
-
157
-
158
-
159
-
160
-
161
-
162
-
163
-
164
-
165
-
166
-
167
-
168
-
169
-
170
-
171
-
172
-
173
-
174
-
175
-
176
-
177
-
178
-
179
-
180
-
181
-
182
-
183
-
184
-
185
-
186
-
187
-
188
-
189
-
190
-
191
-
192
-
193
-
194
-
195
-
196
-
197
-
198
-
199
-
200
-
201
-
202
-
203
-
204
-
205
-
206
-
207
-
208
-
209
-
210
-
211
-
212
-
213
-
214
-
215
-
216
-
217
-
218
 |
 |

VIRGIN MEDIA INC. AND SUBSIDIARIES
NOTES TO CONSOLIDATED FINANCIAL STATEMENTS (continued)
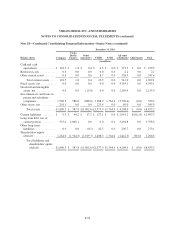
Note 13—Income Taxes (continued)
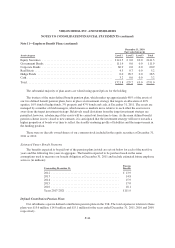
The change in tax rates relates to a reduction in the UK corporate income tax rate from 28% in 2010, to 26%
with effect from 1 April 2011, and to 25% with effect from 1 April 2012. The deferred tax assets and liabilities
presented for 2011 reflect the 25% rate. Further rate changes have been announced that are expected to reduce
the UK corporate income tax rate in equal annual decrements of one percentage point to 23%, but these changes
have not yet been enacted.
A valuation allowance is recorded to reduce the deferred tax assets to an amount that is more likely than not
to be realized. To the extent that a portion of the valuation allowance is reduced, the benefit will be recognized as
a reduction of income tax expense.
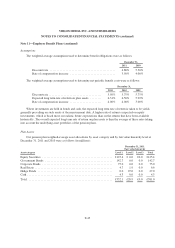
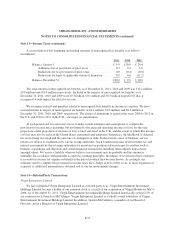
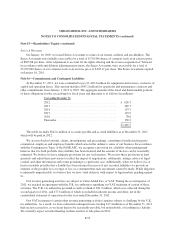
At December 31, 2011, we had net operating loss carryforwards for U.S. federal income tax purposes of
£315 million that expire between 2020 and 2030. We have U.K. net operating loss carryforwards of £2.2 billion
that have no expiration date. Pursuant to U.K. law, these losses are only available to offset income of the legal
entity that generated the loss. A portion of the U.K. net operating loss carryforwards relates to dual resident
companies, of which the U.S. net operating loss carryforward amount is £477 million and expires between 2012
and 2028. Following the completion of a Section 382 study during 2011, we revised downward our estimate of
U.S. net operating loss carryforwards related to these companies from £1.5 billion, which were severely limited
under Section 382, to £477 million, which are not subject to limitation under Section 382. The U.S. net operating
loss carryforwards that relate to dual resident companies are not included in the table above that presents
significant components of our deferred tax assets. We also have U.K. capital loss carryforwards of £12.1 billion
that have no expiration date. However, we do not expect to realize any significant benefit from these capital
losses, which can only be used to the extent we generate future U.K. taxable capital gain income from assets held
by subsidiaries owned by the group prior to the merger with Telewest in 2006.
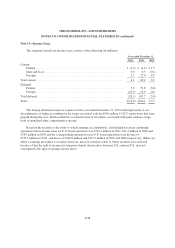
At December 31, 2011, we had fixed assets on which future U.K. tax deductions can be claimed of £12.9
billion. The maximum amount that can be claimed in any one year is 20% of the remaining balance, after
additions, disposals and prior claims. This rate will fall to 18% with effect from 1 April 2012.
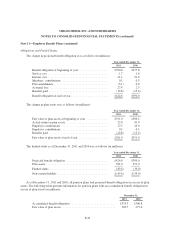
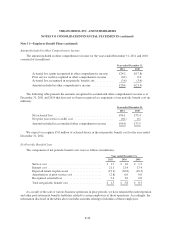
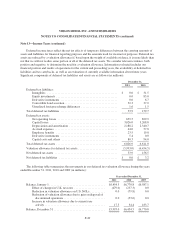
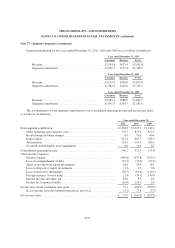
The reconciliation of income taxes computed at U.S. federal statutory rates to income tax (expense) benefit
attributable to continuing operations is as follows (in millions):
Year ended December 31,
2011 2010 2009
(Expense) benefit at federal statutory rate (35%) .............................. £(32.6) £102.7 £123.5
Add:
Permanent book-tax differences ....................................... (55.2) (36.6) (24.6)
Increase (decrease) in valuation allowance due to current year activity ........ 78.1 (41.5) (76.1)
Difference between U.S. and foreign tax rates ............................ 17.6 (17.9) (22.1)
State and local tax rate .............................................. 0.0 0.3 (0.1)
Reduction in valuation allowance on U.S. NOLs .......................... 0.0 79.8 0.0
Foreign tax (expense) benefit from discontinued operations and OCI .......... (23.3) 42.2 0.0
Other ............................................................ (0.6) (4.9) 1.9
(Expense) benefit for income taxes ........................................ £(16.0) £124.1 £ 2.5
F-50