Virgin Media 2011 Annual Report Download - page 166
Download and view the complete annual report
Please find page 166 of the 2011 Virgin Media annual report below. You can navigate through the pages in the report by either clicking on the pages listed below, or by using the keyword search tool below to find specific information within the annual report.-
 1
1 -
2
-
3
-
4
-
5
-
6
-
7
-
8
-
9
-
10
-
11
-
12
-
13
-
14
-
15
-
16
-
17
-
18
-
19
-
20
-
21
-
22
-
23
-
24
-
25
-
26
-
27
-
28
-
29
-
30
-
31
-
32
-
33
-
34
-
35
-
36
-
37
-
38
-
39
-
40
-
41
-
42
-
43
-
44
-
45
-
46
-
47
-
48
-
49
-
50
-
51
-
52
-
53
-
54
-
55
-
56
-
57
-
58
-
59
-
60
-
61
-
62
-
63
-
64
-
65
-
66
-
67
-
68
-
69
-
70
-
71
-
72
-
73
-
74
-
75
-
76
-
77
-
78
-
79
-
80
-
81
-
82
-
83
-
84
-
85
-
86
-
87
-
88
-
89
-
90
-
91
-
92
-
93
-
94
-
95
-
96
-
97
-
98
-
99
-
100
-
101
-
102
-
103
-
104
-
105
-
106
-
107
-
108
-
109
-
110
-
111
-
112
-
113
-
114
-
115
-
116
-
117
-
118
-
119
-
120
-
121
-
122
-
123
-
124
-
125
-
126
-
127
-
128
-
129
-
130
-
131
-
132
-
133
-
134
-
135
-
136
-
137
-
138
-
139
-
140
-
141
-
142
-
143
-
144
-
145
-
146
-
147
-
148
-
149
-
150
-
151
-
152
-
153
-
154
-
155
-
 156
156 -
 157
157 -
 158
158 -
 159
159 -
 160
160 -
 161
161 -
 162
162 -
 163
163 -
 164
164 -
 165
165 -
 166
166 -
 167
167 -
 168
168 -
 169
169 -
 170
170 -
 171
171 -
 172
172 -
 173
173 -
 174
174 -
 175
175 -
 176
176 -
177
-
178
-
179
-
180
-
181
-
182
-
183
-
184
-
185
-
186
-
187
-
188
-
189
-
190
-
191
-
192
-
193
-
194
-
195
-
196
-
197
-
198
-
199
-
200
-
201
-
202
-
203
-
204
-
205
-
206
-
207
-
208
-
209
-
210
-
211
-
212
-
213
-
214
-
215
-
216
-
217
-
218
 |
 |

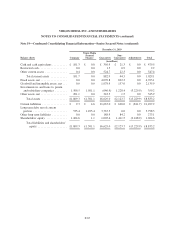
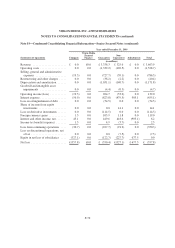
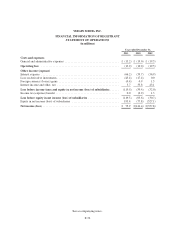
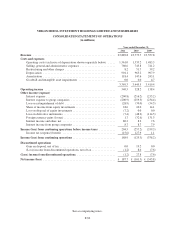
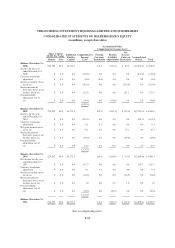
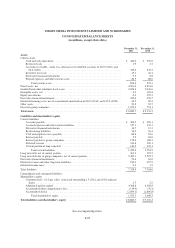
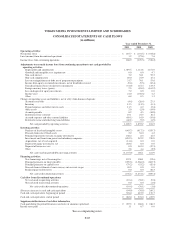
VIRGIN MEDIA INC.
FINANCIAL INFORMATION OF REGISTRANT
STATEMENT OF CASH FLOWS
(in millions)
Year ended December 31,
2011 2010 2009
Net cash used in operating activities ...................................... £ (56.1) £ (34.5) £ (8.5)
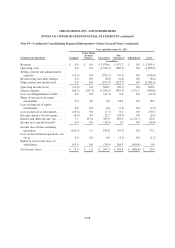
Investing activities
Principal repayments on loans to group companies ....................... 621.6 479.9 0.0
Net cash provided by investing activities ............................... 621.6 479.9 0.0
Financing activities
Common stock repurchases ......................................... (635.0) (161.5) 0.0
Purchase of conversion hedges ...................................... 0.0 (205.4) 0.0
Proceeds from employee stock option exercises ......................... 17.5 17.0 2.5
Intercompany funding movements .................................... 0.0 22.8 43.6
Dividends paid ................................................... (31.1) (34.1) (33.3)
Net cash (used in) provided by financing activities ................... (648.6) (361.2) 12.8
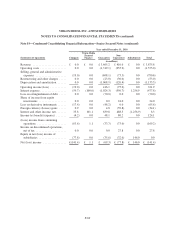
Effect of exchange rate changes on cash and cash equivalents .................. (2.0) 4.7 (1.8)
(Decrease) increase in cash and cash equivalents ............................ (85.1) 88.9 2.5
Cash and cash equivalents at beginning of year .............................. 101.3 12.4 9.9
Cash and cash equivalents at end of year ................................... £ 16.2 £ 101.3 £ 12.4
Supplemental disclosure of cashflow information
Cash paid for interest .................................................. £ 40.5 £ 42.2 £ 40.7
Income taxes paid (received) ............................................ 0.0 1.2 (0.1)
See accompanying notes.
F-77