Virgin Media 2011 Annual Report Download - page 43
Download and view the complete annual report
Please find page 43 of the 2011 Virgin Media annual report below. You can navigate through the pages in the report by either clicking on the pages listed below, or by using the keyword search tool below to find specific information within the annual report.-
 1
1 -
2
-
3
-
4
-
5
-
6
-
7
-
8
-
9
-
10
-
11
-
12
-
13
-
14
-
15
-
16
-
17
-
18
-
19
-
20
-
21
-
22
-
23
-
24
-
25
-
26
-
27
-
28
-
29
-
30
-
31
-
32
-
 33
33 -
 34
34 -
 35
35 -
 36
36 -
 37
37 -
 38
38 -
 39
39 -
 40
40 -
 41
41 -
 42
42 -
 43
43 -
 44
44 -
 45
45 -
 46
46 -
 47
47 -
 48
48 -
 49
49 -
 50
50 -
 51
51 -
 52
52 -
 53
53 -
54
-
55
-
56
-
57
-
58
-
59
-
60
-
61
-
62
-
63
-
64
-
65
-
66
-
67
-
68
-
69
-
70
-
71
-
72
-
73
-
74
-
75
-
76
-
77
-
78
-
79
-
80
-
81
-
82
-
83
-
84
-
85
-
86
-
87
-
88
-
89
-
90
-
91
-
92
-
93
-
94
-
95
-
96
-
97
-
98
-
99
-
100
-
101
-
102
-
103
-
104
-
105
-
106
-
107
-
108
-
109
-
110
-
111
-
112
-
113
-
114
-
115
-
116
-
117
-
118
-
119
-
120
-
121
-
122
-
123
-
124
-
125
-
126
-
127
-
128
-
129
-
130
-
131
-
132
-
133
-
134
-
135
-
136
-
137
-
138
-
139
-
140
-
141
-
142
-
143
-
144
-
145
-
146
-
147
-
148
-
149
-
150
-
151
-
152
-
153
-
154
-
155
-
156
-
157
-
158
-
159
-
160
-
161
-
162
-
163
-
164
-
165
-
166
-
167
-
168
-
169
-
170
-
171
-
172
-
173
-
174
-
175
-
176
-
177
-
178
-
179
-
180
-
181
-
182
-
183
-
184
-
185
-
186
-
187
-
188
-
189
-
190
-
191
-
192
-
193
-
194
-
195
-
196
-
197
-
198
-
199
-
200
-
201
-
202
-
203
-
204
-
205
-
206
-
207
-
208
-
209
-
210
-
211
-
212
-
213
-
214
-
215
-
216
-
217
-
218
 |
 |
Currency and Interest Rate Movements. We encounter currency exchange rate risks because substantially
all of our revenue and operating costs are earned and paid primarily in U.K. pounds sterling, but we pay interest
and principal obligations with respect to a portion of our existing indebtedness in U.S. dollars and euros. We
have in place hedging programs that seek to mitigate the risk from these exposures. While the objective of these
programs is to reduce the volatility of our cash flows and earnings caused by changes in underlying currency
exchange rates, not all of our exposures are hedged, and not all of our hedges are designated as such for
accounting purposes. Additionally, we do not hedge the principal portion of our convertible senior notes. We also
purchase goods and services in U.S. dollars, euros and South African rand, such as customer premise equipment
and network maintenance services and a substantial portion of these exposures are not hedged.
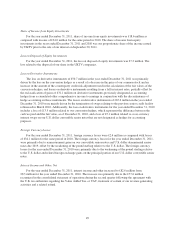
We are also subject to interest rate risks. As of December 31, 2011, we had interest determined on a variable
basis, either through unhedged variable rate debt or derivative hedging contracts, on £1,108.9 million of our long
term debt. An increase in interest rates of 1% would increase our interest cost by approximately £11.1 million per
year.
Competition. Our ability to acquire and retain customers and increase revenue depends on our competitive
strength. There is significant competition in the market for our consumer services, including broadband and
telephone services offered by BT; resellers or local loop unbundlers, such as BSkyB and Talk Talk; alternative
internet access services such as DSL; satellite television services offered by BSkyB and by BBC and ITV
through Freesat; free-to-air digital terrestrial television offered through Freeview; internet protocol television
offered by BT; and mobile telephone, television and data services offered by other mobile network operators, or
MNOs, including Everything Everywhere Limited (the joint venture between T-Mobile (UK) and Orange (UK)),
O2, Vodafone and 3 UK, and from other mobile virtual network operators, including Tesco Mobile, Lebara,
Carphone Warehouse and ASDA. In addition, certain competitors, such as BT, BSkyB and large MNOs, are
dominant in markets in which we compete and may use their dominance in those markets to offer bundled
services that compete with our product offerings. As a result of increased competition, we have had to, and may
be required to continue to, adjust our pricing and offer discounts to new and existing customers in order to attract
and retain customers. There is also significant competition in the market for our business services, including data
and voice services offered by BT, Cable & Wireless, virtual network operators and systems integrators. While
BT represents the main competitive threat nationally due to its network reach and product portfolio, we also
compete with regional providers, such as COLT Telecom, which have a strong network presence within limited
geographic areas.
Capital Expenditures. Our business requires substantial capital expenditures on a continuing basis for
various purposes, including expanding, maintaining and upgrading our cable network, investing in new customer
acquisitions, and offering new services. If we do not continue to invest in our network and in new technologies,
our ability to retain and acquire customers may be hindered. Therefore, our liquidity and the availability of cash
to fund capital projects are important drivers of our revenue. When our liquidity is restricted, so is our ability to
meet our capital expenditure requirements. On January 11, 2012, we announced a major program to double the
speeds of over four million broadband customers. This will involve an incremental investment of approximately
£110 million during 2012.
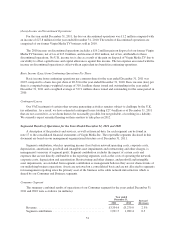
Consumer Segment
In our Consumer segment, cable customers account for the majority of our revenue. The number of
customers, the number and types of services that each customer uses and the prices we charge for these services
drive our revenue. Our profit is driven by the relative margins on the types of services we provide to these
customers and by the number of services that we provide to them and, with respect to our fixed and mobile
telephone customers, by usage levels of our services. For example, cable broadband internet is more profitable
than our television services and, on average, our “triple-play” customers are more profitable than “double-play”
or “single-play” customers. Similarly, over the service term, our contract mobile customers are more profitable
than our prepay mobile customers, and provide a better opportunity for cross-sell of our cable products. We
actively promote “quad-play” services and our packaging of services and our pricing are designed to encourage
42