Virgin Media 2011 Annual Report Download - page 129
Download and view the complete annual report
Please find page 129 of the 2011 Virgin Media annual report below. You can navigate through the pages in the report by either clicking on the pages listed below, or by using the keyword search tool below to find specific information within the annual report.-
 1
1 -
2
-
3
-
4
-
5
-
6
-
7
-
8
-
9
-
10
-
11
-
12
-
13
-
14
-
15
-
16
-
17
-
18
-
19
-
20
-
21
-
22
-
23
-
24
-
25
-
26
-
27
-
28
-
29
-
30
-
31
-
32
-
33
-
34
-
35
-
36
-
37
-
38
-
39
-
40
-
41
-
42
-
43
-
44
-
45
-
46
-
47
-
48
-
49
-
50
-
51
-
52
-
53
-
54
-
55
-
56
-
57
-
58
-
59
-
60
-
61
-
62
-
63
-
64
-
65
-
66
-
67
-
68
-
69
-
70
-
71
-
72
-
73
-
74
-
75
-
76
-
77
-
78
-
79
-
80
-
81
-
82
-
83
-
84
-
85
-
86
-
87
-
88
-
89
-
90
-
91
-
92
-
93
-
94
-
95
-
96
-
97
-
98
-
99
-
100
-
101
-
102
-
103
-
104
-
105
-
106
-
107
-
108
-
109
-
110
-
111
-
112
-
113
-
114
-
115
-
116
-
117
-
118
-
 119
119 -
 120
120 -
 121
121 -
 122
122 -
 123
123 -
 124
124 -
 125
125 -
 126
126 -
 127
127 -
 128
128 -
 129
129 -
 130
130 -
 131
131 -
 132
132 -
 133
133 -
 134
134 -
 135
135 -
 136
136 -
 137
137 -
 138
138 -
 139
139 -
140
-
141
-
142
-
143
-
144
-
145
-
146
-
147
-
148
-
149
-
150
-
151
-
152
-
153
-
154
-
155
-
156
-
157
-
158
-
159
-
160
-
161
-
162
-
163
-
164
-
165
-
166
-
167
-
168
-
169
-
170
-
171
-
172
-
173
-
174
-
175
-
176
-
177
-
178
-
179
-
180
-
181
-
182
-
183
-
184
-
185
-
186
-
187
-
188
-
189
-
190
-
191
-
192
-
193
-
194
-
195
-
196
-
197
-
198
-
199
-
200
-
201
-
202
-
203
-
204
-
205
-
206
-
207
-
208
-
209
-
210
-
211
-
212
-
213
-
214
-
215
-
216
-
217
-
218
 |
 |

VIRGIN MEDIA INC. AND SUBSIDIARIES
NOTES TO CONSOLIDATED FINANCIAL STATEMENTS (continued)
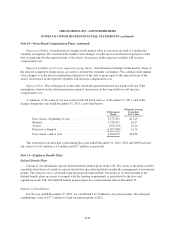
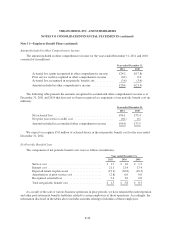
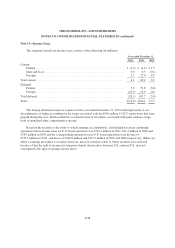
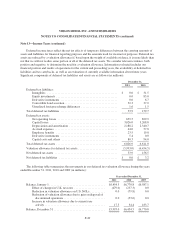
Note 10—Stock-Based Compensation Plans (continued)
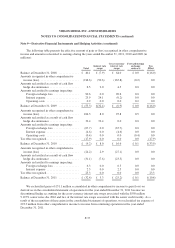
A summary of the status of our stock option grants outstanding as of December 31, 2011 pursuant to the
stock incentive plans and the Virgin Media Sharesave Plan and of the changes during the year ended
December 31, 2011, is provided below:
Stock Incentive Plans
Virgin Media
Sharesave Total
Weighted
Average
Exercise
Price
Non-performance
Based
Performance
Based
Outstanding—beginning of year ......... 14,808,323 725,156 3,201,115 18,734,594 $14.96
Granted ............................ 2,086,069 0 1,176,735 3,262,804 23.09
Exercised ........................... (4,297,133) (35,156) (1,472,728) (5,805,017) 14.97
Forfeited or Expired ................... (1,671,967) 0 (237,612) (1,909,579) 15.73
Outstanding—end of year .............. 10,925,292 690,000 2,667,510 14,282,802 16.71
Exercisable at end of the year ........... 4,508,022 378,000 0 4,886,022 18.42
Expected to vest ...................... 5,834,107 287,040 2,185,866 8,307,013 $15.61
The weighted-average grant-date fair value of options granted during the years ended December 31, 2011,
2010 and 2009, was $10.44, $8.81 and $3.86, respectively. The total intrinsic value of options exercised during
the years ended December 31, 2011, 2010 and 2009, was £31.1 million, £20.6 million and £1.2 million,
respectively.
For performance based option grants the performance objectives are set by the Compensation Committee of
the Board of Directors based upon quantitative and qualitative objectives, including earnings and stock price
performance, amongst others. These objectives may be absolute or relative to prior performance or to the
performance of other entities, indices or benchmarks and may be expressed in terms of progression within a
specific range.
The aggregate intrinsic value of options outstanding as at December 31, 2011 was £53.7 million with a
weighted average remaining contractual term of 6.6 years. The aggregate intrinsic value of options exercisable as
at December 31, 2011 was £15.2 million with a weighted average remaining contractual term of 5.9 years. The
aggregate intrinsic value of options expected to vest as at December 31, 2011 was £35.2 million with a weighted
average remaining contractual term of 6.9 years.
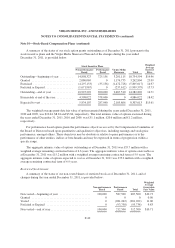
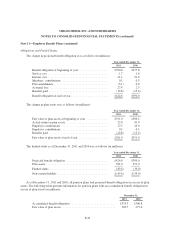
Restricted Stock Grants
A summary of the status of our non-vested shares of restricted stock as of December 31, 2011, and of
changes during the year ended December 31, 2011, is provided below:
Non-performance
Based
Performance
Based Total
Weighted
Average
Grant-date
Fair Value
Non-vested—beginning of year ..................... 100,000 587,500 687,500 $10.73
Granted ........................................ 0 0 0 0.00
Vested ......................................... 0 (281,262) (281,262) 11.06
Forfeited or Expired .............................. 0 (93,738) (93,738) 9.83
Non-vested—end of year ........................... 100,000 212,500 312,500 $10.71
F-40