Virgin Media 2011 Annual Report Download - page 118
Download and view the complete annual report
Please find page 118 of the 2011 Virgin Media annual report below. You can navigate through the pages in the report by either clicking on the pages listed below, or by using the keyword search tool below to find specific information within the annual report.-
 1
1 -
2
-
3
-
4
-
5
-
6
-
7
-
8
-
9
-
10
-
11
-
12
-
13
-
14
-
15
-
16
-
17
-
18
-
19
-
20
-
21
-
22
-
23
-
24
-
25
-
26
-
27
-
28
-
29
-
30
-
31
-
32
-
33
-
34
-
35
-
36
-
37
-
38
-
39
-
40
-
41
-
42
-
43
-
44
-
45
-
46
-
47
-
48
-
49
-
50
-
51
-
52
-
53
-
54
-
55
-
56
-
57
-
58
-
59
-
60
-
61
-
62
-
63
-
64
-
65
-
66
-
67
-
68
-
69
-
70
-
71
-
72
-
73
-
74
-
75
-
76
-
77
-
78
-
79
-
80
-
81
-
82
-
83
-
84
-
85
-
86
-
87
-
88
-
89
-
90
-
91
-
92
-
93
-
94
-
95
-
96
-
97
-
98
-
99
-
100
-
101
-
102
-
103
-
104
-
105
-
106
-
107
-
 108
108 -
 109
109 -
 110
110 -
 111
111 -
 112
112 -
 113
113 -
 114
114 -
 115
115 -
 116
116 -
 117
117 -
 118
118 -
 119
119 -
 120
120 -
 121
121 -
 122
122 -
 123
123 -
 124
124 -
 125
125 -
 126
126 -
 127
127 -
 128
128 -
129
-
130
-
131
-
132
-
133
-
134
-
135
-
136
-
137
-
138
-
139
-
140
-
141
-
142
-
143
-
144
-
145
-
146
-
147
-
148
-
149
-
150
-
151
-
152
-
153
-
154
-
155
-
156
-
157
-
158
-
159
-
160
-
161
-
162
-
163
-
164
-
165
-
166
-
167
-
168
-
169
-
170
-
171
-
172
-
173
-
174
-
175
-
176
-
177
-
178
-
179
-
180
-
181
-
182
-
183
-
184
-
185
-
186
-
187
-
188
-
189
-
190
-
191
-
192
-
193
-
194
-
195
-
196
-
197
-
198
-
199
-
200
-
201
-
202
-
203
-
204
-
205
-
206
-
207
-
208
-
209
-
210
-
211
-
212
-
213
-
214
-
215
-
216
-
217
-
218
 |
 |

VIRGIN MEDIA INC. AND SUBSIDIARIES
NOTES TO CONSOLIDATED FINANCIAL STATEMENTS (continued)
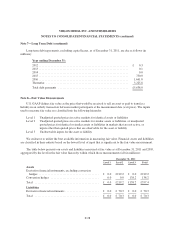
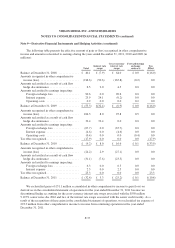
Note 8—Fair Value Measurements (continued)
December 31, 2010
Level 1 Level 2 Level 3 Total
Assets
Derivative financial instruments, excluding conversion
hedges ......................................... £ 0.0 £203.5 £ 0.0 £203.5
Conversion hedges ................................. 0.0 0.0 191.9 191.9
Total ............................................ £ 0.0 £203.5 £191.9 £395.4
Liabilities
Derivative financial instruments ....................... £ 0.0 £ 75.3 £ 0.0 £ 75.3
Total ............................................ £ 0.0 £ 75.3 £ 0.0 £ 75.3
In estimating the fair value of our financial assets and liabilities, we used the following methods and
assumptions:
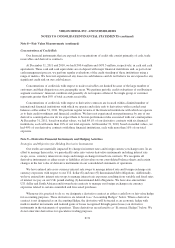
Derivative financial instruments: As a result of our financing activities, we are exposed to market risks from
changes in interest and foreign currency exchange rates, which may adversely affect our operating results and
financial position. When deemed appropriate, we minimize our risks from interest and foreign currency exchange
rate fluctuations through the use of derivative financial instruments. The foreign currency forward rate contracts,
interest rate swaps and cross-currency interest rate swaps are valued using internal models based on observable
inputs, counterparty valuations, or market transactions in either the listed or over-the-counter markets, adjusted
for non-performance risk. As such, these derivative instruments are classified within level 2 in the fair value
hierarchy. The carrying amounts of our derivative financial instruments are disclosed in note 9.
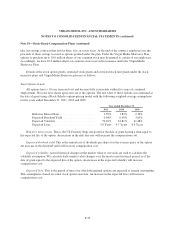
Valuation of conversion hedges: Because the conversion hedges do not qualify for equity classification, the
fair values have been included as a non-current derivative financial asset in the consolidated balance sheets. The
conversion hedges may only be exercised by us upon maturity of the convertible senior notes. As of
December 31, 2011, the fair value of these instruments was estimated to be £138.2 million using the Black-
Scholes Merton valuation technique. In accordance with the authoritative guidance, fair value represents an
estimate of the exit price that would be received upon disposal of the conversion hedges as of the balance sheet
date. The fair values of the conversion hedges are primarily impacted by our stock price but are also impacted by
the duration of the options, the strike price ($19.22 per share) of the instrument, the cap price ($35 per share) of
the instrument, expected volatility of our stock price, the dividend yield on our stock, exchange rates, and
counterparty non-performance risk. The table below presents the estimated impact on the December 31, 2011 fair
value of a hypothetical 20% increase and decrease in our stock price (holding all other inputs constant):
December 31,
2011
Estimated fair value of conversion hedges as reported ........................... £138.2
Estimated fair value of conversion hedges assuming a 20% increase in our stock
price ................................................................ £175.5
Estimated fair value of conversion hedges assuming a 20% decrease in our stock
price ................................................................ £ 97.7
Future changes in fair values of the conversion hedges will be reported as gains (losses) on derivative
instruments in the consolidated statement of operations.
F-29