Virgin Media 2011 Annual Report Download - page 146
Download and view the complete annual report
Please find page 146 of the 2011 Virgin Media annual report below. You can navigate through the pages in the report by either clicking on the pages listed below, or by using the keyword search tool below to find specific information within the annual report.-
 1
1 -
2
-
3
-
4
-
5
-
6
-
7
-
8
-
9
-
10
-
11
-
12
-
13
-
14
-
15
-
16
-
17
-
18
-
19
-
20
-
21
-
22
-
23
-
24
-
25
-
26
-
27
-
28
-
29
-
30
-
31
-
32
-
33
-
34
-
35
-
36
-
37
-
38
-
39
-
40
-
41
-
42
-
43
-
44
-
45
-
46
-
47
-
48
-
49
-
50
-
51
-
52
-
53
-
54
-
55
-
56
-
57
-
58
-
59
-
60
-
61
-
62
-
63
-
64
-
65
-
66
-
67
-
68
-
69
-
70
-
71
-
72
-
73
-
74
-
75
-
76
-
77
-
78
-
79
-
80
-
81
-
82
-
83
-
84
-
85
-
86
-
87
-
88
-
89
-
90
-
91
-
92
-
93
-
94
-
95
-
96
-
97
-
98
-
99
-
100
-
101
-
102
-
103
-
104
-
105
-
106
-
107
-
108
-
109
-
110
-
111
-
112
-
113
-
114
-
115
-
116
-
117
-
118
-
119
-
120
-
121
-
122
-
123
-
124
-
125
-
126
-
127
-
128
-
129
-
130
-
131
-
132
-
133
-
134
-
135
-
 136
136 -
 137
137 -
 138
138 -
 139
139 -
 140
140 -
 141
141 -
 142
142 -
 143
143 -
 144
144 -
 145
145 -
 146
146 -
 147
147 -
 148
148 -
 149
149 -
 150
150 -
 151
151 -
 152
152 -
 153
153 -
 154
154 -
 155
155 -
 156
156 -
157
-
158
-
159
-
160
-
161
-
162
-
163
-
164
-
165
-
166
-
167
-
168
-
169
-
170
-
171
-
172
-
173
-
174
-
175
-
176
-
177
-
178
-
179
-
180
-
181
-
182
-
183
-
184
-
185
-
186
-
187
-
188
-
189
-
190
-
191
-
192
-
193
-
194
-
195
-
196
-
197
-
198
-
199
-
200
-
201
-
202
-
203
-
204
-
205
-
206
-
207
-
208
-
209
-
210
-
211
-
212
-
213
-
214
-
215
-
216
-
217
-
218
 |
 |

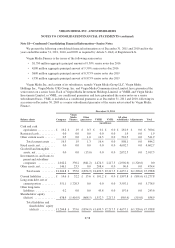
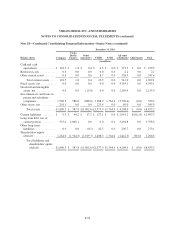
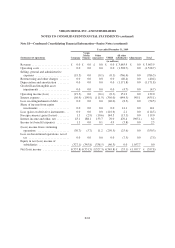
VIRGIN MEDIA INC. AND SUBSIDIARIES
NOTES TO CONSOLIDATED FINANCIAL STATEMENTS (continued)
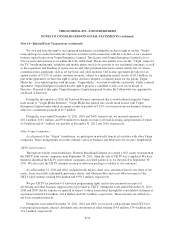
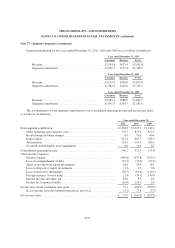
Note 17—Industry Segments (continued)
Segment information for the years ended December 31, 2011, 2010 and 2009 was as follows (in millions):
Year ended December 31, 2011
Consumer Business Total
Revenue ....................................... £3,354.4 £637.4 £3,991.8
Segment contribution ............................ £1,991.5 £377.4 £2,368.9
Year ended December 31, 2010
Consumer Business Total
Revenue ....................................... £3,279.0 £596.8 £3,875.8
Segment contribution ............................ £1,982.4 £342.8 £2,325.2
Year ended December 31, 2009
Consumer Business Total
Revenue ....................................... £3,083.1 £580.8 £3,663.9
Segment contribution ............................ £1,841.9 £339.7 £2,181.6
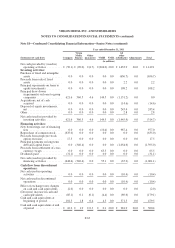
The reconciliation of total segment contribution to our consolidated operating income and net income (loss)
is as follows (in millions):
Year ended December 31,
2011 2010 2009
Total segment contribution .......................................... £2,368.9 £2,325.2 £2,181.6
Other operating and corporate costs ............................... 778.7 815.0 832.7
Restructuring and other charges .................................. 8.4 53.0 40.4
Depreciation ................................................. 923.2 987.7 928.7
Amortization ................................................. 118.4 147.6 243.1
Goodwill and intangible asset impairment .......................... 0.0 0.0 4.7
Consolidated operating income ....................................... 540.2 321.9 132.0
Other income (expense)
Interest expense ............................................... (440.8) (477.8) (455.1)
Loss on extinguishment of debt .................................. (47.2) (70.0) (54.5)
Share of income from equity investments ........................... 18.6 24.0 14.1
Loss on disposal of equity investments ............................. (7.2) 0.0 0.0
Loss on derivative instruments ................................... (50.7) (65.6) (114.5)
Foreign currency (losses) gains ................................... (2.4) (34.1) 119.0
Interest income and other, net .................................... 82.6 8.3 6.2
Income tax (expense) benefit .................................... (16.0) 124.1 2.5
Income (loss) from continuing operations .............................. 77.1 (169.2) (350.3)
(Loss) income from discontinued operations, net of tax ................ (1.2) 27.8 (7.5)
Net income (loss) ................................................. £ 75.9 £ (141.4) £ (357.8)
F-57