Virgin Media 2011 Annual Report Download - page 61
Download and view the complete annual report
Please find page 61 of the 2011 Virgin Media annual report below. You can navigate through the pages in the report by either clicking on the pages listed below, or by using the keyword search tool below to find specific information within the annual report.-
 1
1 -
2
-
3
-
4
-
5
-
6
-
7
-
8
-
9
-
10
-
11
-
12
-
13
-
14
-
15
-
16
-
17
-
18
-
19
-
20
-
21
-
22
-
23
-
24
-
25
-
26
-
27
-
28
-
29
-
30
-
31
-
32
-
33
-
34
-
35
-
36
-
37
-
38
-
39
-
40
-
41
-
42
-
43
-
44
-
45
-
46
-
47
-
48
-
49
-
50
-
 51
51 -
 52
52 -
 53
53 -
 54
54 -
 55
55 -
 56
56 -
 57
57 -
 58
58 -
 59
59 -
 60
60 -
 61
61 -
 62
62 -
 63
63 -
 64
64 -
 65
65 -
 66
66 -
 67
67 -
 68
68 -
 69
69 -
 70
70 -
 71
71 -
72
-
73
-
74
-
75
-
76
-
77
-
78
-
79
-
80
-
81
-
82
-
83
-
84
-
85
-
86
-
87
-
88
-
89
-
90
-
91
-
92
-
93
-
94
-
95
-
96
-
97
-
98
-
99
-
100
-
101
-
102
-
103
-
104
-
105
-
106
-
107
-
108
-
109
-
110
-
111
-
112
-
113
-
114
-
115
-
116
-
117
-
118
-
119
-
120
-
121
-
122
-
123
-
124
-
125
-
126
-
127
-
128
-
129
-
130
-
131
-
132
-
133
-
134
-
135
-
136
-
137
-
138
-
139
-
140
-
141
-
142
-
143
-
144
-
145
-
146
-
147
-
148
-
149
-
150
-
151
-
152
-
153
-
154
-
155
-
156
-
157
-
158
-
159
-
160
-
161
-
162
-
163
-
164
-
165
-
166
-
167
-
168
-
169
-
170
-
171
-
172
-
173
-
174
-
175
-
176
-
177
-
178
-
179
-
180
-
181
-
182
-
183
-
184
-
185
-
186
-
187
-
188
-
189
-
190
-
191
-
192
-
193
-
194
-
195
-
196
-
197
-
198
-
199
-
200
-
201
-
202
-
203
-
204
-
205
-
206
-
207
-
208
-
209
-
210
-
211
-
212
-
213
-
214
-
215
-
216
-
217
-
218
 |
 |

which represents the difference between the cash we paid and the fair value, as of December 31, 2010, and a loss
of £10.2 million related to cross-currency interest swaps on our U.S. dollar convertible senior notes that are not
designated as hedges for accounting purposes. The losses on derivative instruments of £114.5 million in the year
ended December 31, 2009, were mainly driven by the U.S. dollar and euro weakening against the pound sterling
in the first six months of the year, which resulted in a reduction in the fair value of the U.S. dollar and euro
denominated cross-currency interest rate swaps not designated as hedges for accounting purposes
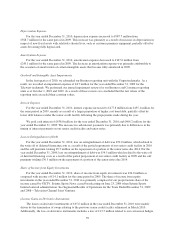
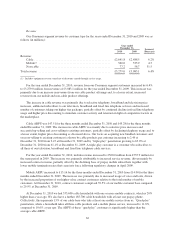
Foreign Currency Gains (Losses)
For the year ended December 31, 2010, foreign currency losses were £34.1 million as compared with gains
of £119.0 million for the same period in 2009. The foreign currency losses for the year ended December 31, 2010
were primarily due to the weakening of the pound sterling relative to the U.S. dollar and related foreign exchange
gains on the principal portion of our U.S. dollar convertible senior notes. The foreign currency gains in the year
ended December 31, 2009 were primarily due to the strengthening of the pound sterling which occurred in the
first six months of the year relative to the U.S. dollar and euro and related foreign exchange gains on the
principal portion of our U.S. dollar convertible senior notes, which is unhedged, and the U.S. dollar and euro
denominated tranches of the previous senior credit facility.
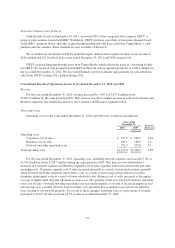
Interest Income and Other, Net
For the year ended December 31, 2010, interest income and other increased to £8.3 million from £6.2 million for
the year ended December 31, 2009, primarily as a result of higher cash balances over the period.
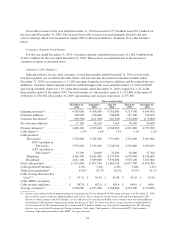
Income Tax Benefit
For the year ended December 31, 2010, income tax benefit was £124.1 million as compared with
£2.5 million for the same period in 2009. The 2010 and 2009 tax benefit was comprised of (in millions):
2010 2009
Current:
Federal ................................................................... £ (4.9) £ 1.5
State and local ............................................................. 0.3 (0.1)
Foreign ................................................................... 25.0 4.9
Total current ................................................................... 20.4 6.3
Deferred:
Federal ................................................................... 79.8 (3.8)
Foreign ................................................................... 23.9 0.0
Total deferred .................................................................. 103.7 (3.8)
Total ......................................................................... £124.1 £ 2.5
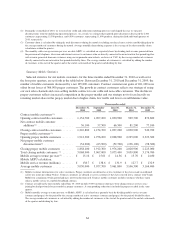
The foreign current tax benefit and the foreign deferred tax benefit were primarily driven by the application
of the intraperiod allocation rules of the Income Taxes Topic of the FASB ASC. The foreign current tax benefit
attributable to continuing operations includes £18.3 million related to the gain on discontinued operations and is
offset by tax expense of £18.3 million that is included within discontinued operations. The £23.9 million foreign
deferred tax benefit attributable to continuing operations is offset by tax expense of £23.9 million that is included
within other comprehensive as a result of gains in other comprehensive income during 2010.
Additionally, during 2010 we concluded that it was more likely than not that we would be able to utilize
certain net operating loss carryforwards prior to their expiration, which will occur between 2020 and 2030, to
reduce future U.S. federal income tax liabilities. Accordingly, we reduced the previously established valuation
60