Virgin Media 2011 Annual Report Download - page 120
Download and view the complete annual report
Please find page 120 of the 2011 Virgin Media annual report below. You can navigate through the pages in the report by either clicking on the pages listed below, or by using the keyword search tool below to find specific information within the annual report.-
 1
1 -
2
-
3
-
4
-
5
-
6
-
7
-
8
-
9
-
10
-
11
-
12
-
13
-
14
-
15
-
16
-
17
-
18
-
19
-
20
-
21
-
22
-
23
-
24
-
25
-
26
-
27
-
28
-
29
-
30
-
31
-
32
-
33
-
34
-
35
-
36
-
37
-
38
-
39
-
40
-
41
-
42
-
43
-
44
-
45
-
46
-
47
-
48
-
49
-
50
-
51
-
52
-
53
-
54
-
55
-
56
-
57
-
58
-
59
-
60
-
61
-
62
-
63
-
64
-
65
-
66
-
67
-
68
-
69
-
70
-
71
-
72
-
73
-
74
-
75
-
76
-
77
-
78
-
79
-
80
-
81
-
82
-
83
-
84
-
85
-
86
-
87
-
88
-
89
-
90
-
91
-
92
-
93
-
94
-
95
-
96
-
97
-
98
-
99
-
100
-
101
-
102
-
103
-
104
-
105
-
106
-
107
-
108
-
109
-
 110
110 -
 111
111 -
 112
112 -
 113
113 -
 114
114 -
 115
115 -
 116
116 -
 117
117 -
 118
118 -
 119
119 -
 120
120 -
 121
121 -
 122
122 -
 123
123 -
 124
124 -
 125
125 -
 126
126 -
 127
127 -
 128
128 -
 129
129 -
 130
130 -
131
-
132
-
133
-
134
-
135
-
136
-
137
-
138
-
139
-
140
-
141
-
142
-
143
-
144
-
145
-
146
-
147
-
148
-
149
-
150
-
151
-
152
-
153
-
154
-
155
-
156
-
157
-
158
-
159
-
160
-
161
-
162
-
163
-
164
-
165
-
166
-
167
-
168
-
169
-
170
-
171
-
172
-
173
-
174
-
175
-
176
-
177
-
178
-
179
-
180
-
181
-
182
-
183
-
184
-
185
-
186
-
187
-
188
-
189
-
190
-
191
-
192
-
193
-
194
-
195
-
196
-
197
-
198
-
199
-
200
-
201
-
202
-
203
-
204
-
205
-
206
-
207
-
208
-
209
-
210
-
211
-
212
-
213
-
214
-
215
-
216
-
217
-
218
 |
 |
VIRGIN MEDIA INC. AND SUBSIDIARIES
NOTES TO CONSOLIDATED FINANCIAL STATEMENTS (continued)
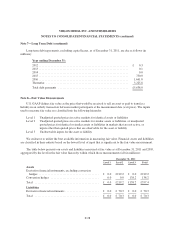
Note 8—Fair Value Measurements (continued)
Concentrations of Credit Risk
Our financial instruments that are exposed to concentrations of credit risk consist primarily of cash, trade
receivables and derivative contracts.
At December 31, 2011 and 2010, we had £300.4 million and £479.5 million, respectively, in cash and cash
equivalents. These cash and cash equivalents are on deposit with major financial institutions and, as part of our
cash management process, we perform regular evaluations of the credit standing of these institutions using a
range of metrics. We have not experienced any losses in cash balances and do not believe we are exposed to any
significant credit risk on our cash balances.
Concentrations of credit risk with respect to trade receivables are limited because of the large number of
customers and their dispersion across geographic areas. We perform periodic credit evaluations of our Business
segment customers’ financial condition and generally do not require collateral. No single group or customer
represents greater than 10% of total accounts receivable.
Concentrations of credit risk with respect to derivative contracts are focused within a limited number of
international financial institutions with which we operate and relate only to derivatives with recorded asset
balances at December 31, 2011. We perform regular reviews of the financial institutions with which we operate
as to their credit worthiness and financial condition. We have not experienced non-performance by any of our
derivative counterparties nor do we expect there to be non-performance risks associated with our counterparties.
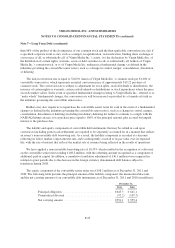
At December 31, 2011, based on market values, we had 84.1% of our derivative contracts with six financial
institutions, each with more than 10% of our total exposure. At December 31, 2010, based on market values, we
had 49% of our derivative contracts with three financial institutions, each with more than 10% of our total
exposure.
Note 9—Derivative Financial Instruments and Hedging Activities
Strategies and Objectives for Holding Derivative Instruments
Our results are materially impacted by changes in interest rates and foreign currency exchange rates. In an
effort to manage these risks, we periodically enter into various derivative instruments including interest rate
swaps, cross- currency interest rate swaps and foreign exchange forward rate contracts. We recognize all
derivative instruments as either assets or liabilities at fair value on our consolidated balance sheets and certain
changes in the fair value of derivative instruments in our consolidated statements of operations.
We have entered into cross-currency interest rate swaps to manage interest rate and foreign exchange rate
currency exposures with respect to our U.S. dollar ($) and euro (€) denominated debt obligations. Additionally,
we have entered into interest rate swaps to manage interest rate exposures resulting from variable and fixed rates
of interest we pay on our U.K. pound sterling (£) denominated debt obligations. We have also entered into
U.S. dollar and South African rand forward rate contracts to manage our foreign exchange rate currency
exposures related to certain committed and forecasted purchases.
Whenever it is practical to do so, we designate a derivative contract as either a cash flow or fair value hedge
for accounting purposes. These derivatives are referred to as “Accounting Hedges” below. When a derivative
contract is not designated as an Accounting Hedge, the derivative will be treated as an economic hedge with
mark-to-market movements and realized gains or losses recognized through gains (losses) on derivative
instruments in the statements of operations. These derivatives are referred to as “Economic Hedges” below. We
do not enter into derivatives for speculative trading purposes.
F-31