Virgin Media 2011 Annual Report Download - page 131
Download and view the complete annual report
Please find page 131 of the 2011 Virgin Media annual report below. You can navigate through the pages in the report by either clicking on the pages listed below, or by using the keyword search tool below to find specific information within the annual report.-
 1
1 -
2
-
3
-
4
-
5
-
6
-
7
-
8
-
9
-
10
-
11
-
12
-
13
-
14
-
15
-
16
-
17
-
18
-
19
-
20
-
21
-
22
-
23
-
24
-
25
-
26
-
27
-
28
-
29
-
30
-
31
-
32
-
33
-
34
-
35
-
36
-
37
-
38
-
39
-
40
-
41
-
42
-
43
-
44
-
45
-
46
-
47
-
48
-
49
-
50
-
51
-
52
-
53
-
54
-
55
-
56
-
57
-
58
-
59
-
60
-
61
-
62
-
63
-
64
-
65
-
66
-
67
-
68
-
69
-
70
-
71
-
72
-
73
-
74
-
75
-
76
-
77
-
78
-
79
-
80
-
81
-
82
-
83
-
84
-
85
-
86
-
87
-
88
-
89
-
90
-
91
-
92
-
93
-
94
-
95
-
96
-
97
-
98
-
99
-
100
-
101
-
102
-
103
-
104
-
105
-
106
-
107
-
108
-
109
-
110
-
111
-
112
-
113
-
114
-
115
-
116
-
117
-
118
-
119
-
120
-
 121
121 -
 122
122 -
 123
123 -
 124
124 -
 125
125 -
 126
126 -
 127
127 -
 128
128 -
 129
129 -
 130
130 -
 131
131 -
 132
132 -
 133
133 -
 134
134 -
 135
135 -
 136
136 -
 137
137 -
 138
138 -
 139
139 -
 140
140 -
 141
141 -
142
-
143
-
144
-
145
-
146
-
147
-
148
-
149
-
150
-
151
-
152
-
153
-
154
-
155
-
156
-
157
-
158
-
159
-
160
-
161
-
162
-
163
-
164
-
165
-
166
-
167
-
168
-
169
-
170
-
171
-
172
-
173
-
174
-
175
-
176
-
177
-
178
-
179
-
180
-
181
-
182
-
183
-
184
-
185
-
186
-
187
-
188
-
189
-
190
-
191
-
192
-
193
-
194
-
195
-
196
-
197
-
198
-
199
-
200
-
201
-
202
-
203
-
204
-
205
-
206
-
207
-
208
-
209
-
210
-
211
-
212
-
213
-
214
-
215
-
216
-
217
-
218
 |
 |

VIRGIN MEDIA INC. AND SUBSIDIARIES
NOTES TO CONSOLIDATED FINANCIAL STATEMENTS (continued)
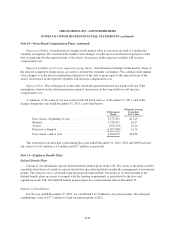
Note 10—Stock-Based Compensation Plans (continued)
Expected volatility. Actual historical changes in the market value of our stock are used to calculate the
volatility assumption. We calculate daily market value changes over the most recent historical period as of the
date of grant equal to the expected term of the award. An increase in the expected volatility will increase
compensation cost.
Expected volatility of selected comparator group shares. Actual historical changes in the market values of
the selected comparator group stocks are used to calculate the volatility assumption. We calculate daily market
value changes over the most recent historical period as of the date of grant equal to the expected term of the
award. An increase in the expected volatility will decrease compensation cost.
Expected lives. This is the period of time after which the granted restricted stock units will vest. This
assumption is based on the stated performance period. An increase in the expected lives will increase
compensation cost.
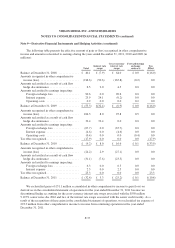
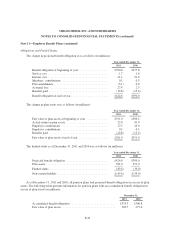
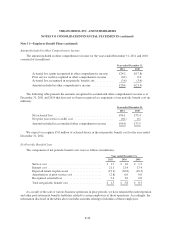
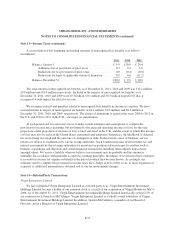
A summary of the status of our non-vested restricted stock units as of December 31, 2011, and of the
changes during the year ended December 31, 2011, is provided below:
Performance
Based
Weighted Average
Grant-date
Fair Value
Non-vested—beginning of year ...................... 5,179,451 $12.29
Granted ......................................... 1,570,471 20.27
Vested .......................................... (974,239) 12.16
Forfeited or Expired ............................... (1,697,008) 13.34
Non-vested—end of year ........................... 4,078,675 $14.96
The restricted stock units that vested during the years ended December 31, 2011, 2010 and 2009 had total
fair values of £16.3 million, £1.8 million and £0.7 million, respectively.
Note 11—Employee Benefit Plans
Defined Benefit Plans
Certain of our subsidiaries operate defined benefit pension plans in the U.K. The assets of the plans are held
separately from those of ourselves and are invested in specialized portfolios under the management of investment
groups. The pension cost is calculated using the projected unit method. Our policy is to fund amounts to the
defined benefit plans necessary to comply with the funding requirements as prescribed by the laws and
regulations in the U.K. Our defined benefit pension plans use a measurement date of December 31.
Employer Contributions
For the year ended December 31, 2011, we contributed £17.5 million to our pension plans. We anticipate
contributing a total of £17.7 million to fund our pension plans in 2012.
F-42