Virgin Media 2011 Annual Report Download - page 49
Download and view the complete annual report
Please find page 49 of the 2011 Virgin Media annual report below. You can navigate through the pages in the report by either clicking on the pages listed below, or by using the keyword search tool below to find specific information within the annual report.-
 1
1 -
2
-
3
-
4
-
5
-
6
-
7
-
8
-
9
-
10
-
11
-
12
-
13
-
14
-
15
-
16
-
17
-
18
-
19
-
20
-
21
-
22
-
23
-
24
-
25
-
26
-
27
-
28
-
29
-
30
-
31
-
32
-
33
-
34
-
35
-
36
-
37
-
38
-
 39
39 -
 40
40 -
 41
41 -
 42
42 -
 43
43 -
 44
44 -
 45
45 -
 46
46 -
 47
47 -
 48
48 -
 49
49 -
 50
50 -
 51
51 -
 52
52 -
 53
53 -
 54
54 -
 55
55 -
 56
56 -
 57
57 -
 58
58 -
 59
59 -
60
-
61
-
62
-
63
-
64
-
65
-
66
-
67
-
68
-
69
-
70
-
71
-
72
-
73
-
74
-
75
-
76
-
77
-
78
-
79
-
80
-
81
-
82
-
83
-
84
-
85
-
86
-
87
-
88
-
89
-
90
-
91
-
92
-
93
-
94
-
95
-
96
-
97
-
98
-
99
-
100
-
101
-
102
-
103
-
104
-
105
-
106
-
107
-
108
-
109
-
110
-
111
-
112
-
113
-
114
-
115
-
116
-
117
-
118
-
119
-
120
-
121
-
122
-
123
-
124
-
125
-
126
-
127
-
128
-
129
-
130
-
131
-
132
-
133
-
134
-
135
-
136
-
137
-
138
-
139
-
140
-
141
-
142
-
143
-
144
-
145
-
146
-
147
-
148
-
149
-
150
-
151
-
152
-
153
-
154
-
155
-
156
-
157
-
158
-
159
-
160
-
161
-
162
-
163
-
164
-
165
-
166
-
167
-
168
-
169
-
170
-
171
-
172
-
173
-
174
-
175
-
176
-
177
-
178
-
179
-
180
-
181
-
182
-
183
-
184
-
185
-
186
-
187
-
188
-
189
-
190
-
191
-
192
-
193
-
194
-
195
-
196
-
197
-
198
-
199
-
200
-
201
-
202
-
203
-
204
-
205
-
206
-
207
-
208
-
209
-
210
-
211
-
212
-
213
-
214
-
215
-
216
-
217
-
218
 |
 |

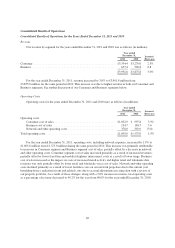
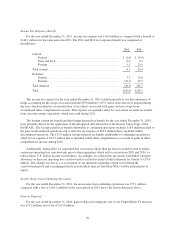
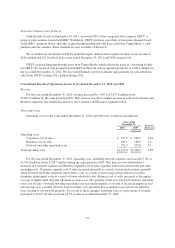
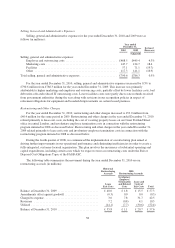
The following table summarizes the movement during the year ended December 31, 2011 on our
restructuring accruals (in millions):
Historical
Restructuring
Accruals
2008
Restructuring Accruals
Total
Lease
Exit Costs
Involuntary
Employee
Termination
and Related
Costs
Lease and
Contract
Exit Costs
Balance, December 31, 2010 ............................. £35.8 £ 1.1 £20.7 £ 57.6
Charged to expense ..................................... 2.4 10.2 5.0 17.6
Revisions ............................................ (5.1) (2.2) (1.9) (9.2)
Utilized .............................................. (14.8) (7.1) (9.2) (31.1)
Balance, December 31, 2011 ............................. £18.3 £ 2.0 £14.6 £ 34.9
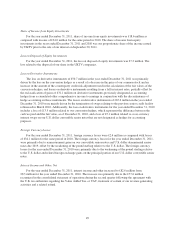
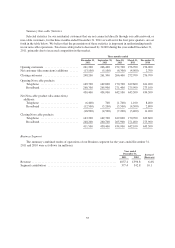
Depreciation Expense
For the year ended December 31, 2011, depreciation expense decreased to £923.2 million from £987.7 million
for the same period in 2010. This increase was primarily as a result of fixed assets becoming fully depreciated,
partially offset by depreciation in respect of new fixed assets.
Amortization Expense
For the year ended December 31, 2011, amortization expense decreased to £118.4 million from £147.6 million
for the same period in 2010. The decrease in amortization expense was primarily attributable to the cessation of
amortization of our intangible assets, all of which became fully amortized in 2011.
Interest Expense
For the year ended December 31, 2011, interest expense decreased to £440.8 million from £477.8 million
for the same period in 2010, primarily due to a reduction in the level of debt and lower borrowing costs on our
debt along with the effect of interest and cross currency rate swaps designated as accounting hedges.
We paid cash interest of £435.2 million for the year ended December 31, 2011 and £438.8 million for the
year ended December 31, 2010. The decrease in cash interest payments was primarily as a result of a lower level
of debt at lower average interest rates during the year ended December 31, 2011, along with differences in the
timing of interest payments on our senior credit facility and senior notes due to refinancing activity undertaken
during the years ended December 31, 2011 and 2010.
Loss on Extinguishment of Debt
For the year ended December 31, 2011, loss on extinguishment of debt was £47.2 million, which related to
the write off of deferred financing costs as a result of the repayments of our senior credit facility from the net
proceeds of the senior secured notes issued on March 3, 2011, the refinancing of our senior credit facility on
May 20, 2011 and the redemption of our senior notes on July 26, 2011. For the year ended December 31, 2010,
loss on extinguishment of debt was £70.0 million, which related to the write off of deferred financing costs as a
result of the partial repayments of our senior credit facility in 2010 and the call premium totaling £5.5 million on
the repayment of a portion of the senior notes due 2014.
48