Virgin Media 2011 Annual Report Download - page 196
Download and view the complete annual report
Please find page 196 of the 2011 Virgin Media annual report below. You can navigate through the pages in the report by either clicking on the pages listed below, or by using the keyword search tool below to find specific information within the annual report.-
 1
1 -
2
-
3
-
4
-
5
-
6
-
7
-
8
-
9
-
10
-
11
-
12
-
13
-
14
-
15
-
16
-
17
-
18
-
19
-
20
-
21
-
22
-
23
-
24
-
25
-
26
-
27
-
28
-
29
-
30
-
31
-
32
-
33
-
34
-
35
-
36
-
37
-
38
-
39
-
40
-
41
-
42
-
43
-
44
-
45
-
46
-
47
-
48
-
49
-
50
-
51
-
52
-
53
-
54
-
55
-
56
-
57
-
58
-
59
-
60
-
61
-
62
-
63
-
64
-
65
-
66
-
67
-
68
-
69
-
70
-
71
-
72
-
73
-
74
-
75
-
76
-
77
-
78
-
79
-
80
-
81
-
82
-
83
-
84
-
85
-
86
-
87
-
88
-
89
-
90
-
91
-
92
-
93
-
94
-
95
-
96
-
97
-
98
-
99
-
100
-
101
-
102
-
103
-
104
-
105
-
106
-
107
-
108
-
109
-
110
-
111
-
112
-
113
-
114
-
115
-
116
-
117
-
118
-
119
-
120
-
121
-
122
-
123
-
124
-
125
-
126
-
127
-
128
-
129
-
130
-
131
-
132
-
133
-
134
-
135
-
136
-
137
-
138
-
139
-
140
-
141
-
142
-
143
-
144
-
145
-
146
-
147
-
148
-
149
-
150
-
151
-
152
-
153
-
154
-
155
-
156
-
157
-
158
-
159
-
160
-
161
-
162
-
163
-
164
-
165
-
166
-
167
-
168
-
169
-
170
-
171
-
172
-
173
-
174
-
175
-
176
-
177
-
178
-
179
-
180
-
181
-
182
-
183
-
184
-
185
-
 186
186 -
 187
187 -
 188
188 -
 189
189 -
 190
190 -
 191
191 -
 192
192 -
 193
193 -
 194
194 -
 195
195 -
 196
196 -
 197
197 -
 198
198 -
 199
199 -
 200
200 -
 201
201 -
 202
202 -
 203
203 -
 204
204 -
 205
205 -
 206
206 -
207
-
208
-
209
-
210
-
211
-
212
-
213
-
214
-
215
-
216
-
217
-
218
 |
 |

VIRGIN MEDIA INVESTMENT HOLDINGS LIMITED AND SUBSIDIARIES
VIRGIN MEDIA INVESTMENTS LIMITED AND SUBSIDIARIES
COMBINED NOTES TO THE CONSOLIDATED FINANCIAL STATEMENTS (continued)
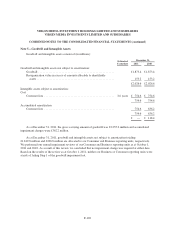
Note 7—Fair Value Measurements (continued)
In estimating the fair value of our other financial instruments, we used the following methods and
assumptions:
Derivative financial instruments: As a result of our financing activities, we are exposed to market risks from
changes in interest and foreign currency exchange rates, which may adversely affect our operating results and
financial position. When deemed appropriate, we minimize our risks from interest and foreign currency exchange
rate fluctuations through the use of derivative financial instruments. The foreign currency forward rate contracts,
interest rate swaps and cross-currency interest rate swaps are valued using internal models based on observable
inputs, counterparty valuations, or market transactions in either the listed or over-the-counter markets, adjusted
for non-performance risk. As such, these derivative instruments are classified within level 2 in the fair value
hierarchy. The carrying amounts of our derivative financial instruments are disclosed in note 8.
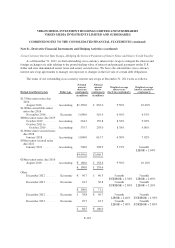
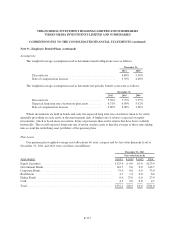
Long term debt: The fair values of our senior notes and senior secured notes are based on the quoted market
prices in active markets and incorporate non-performance risk. The carrying values of the $500 million 5.25%
and £650 million 5.50% senior secured notes due 2021 include adjustments of £45.7 million and £77.9 million,
respectively, as a result of our application of fair value hedge accounting to these instruments.
The carrying amounts and fair values of our long term debt are as follows (in millions):
December 31, 2011 December 31, 2010
Carrying
Amount
Fair
Value
Carrying
Amount
Fair
Value
9.125% U.S. dollar senior notes due 2016 ....................... £ 0.0 £ 0.0 £ 352.6 £ 380.3
6.50% U.S. dollar senior notes due 2016 ........................ 0.0 0.0 176.7 346.8
9.50% U.S. dollar senior notes due 2016 ........................ 849.2 966.4 843.2 990.5
9.50% euro senior notes due 2016 .............................. 145.3 170.1 148.5 182.1
8.375% U.S. dollar senior notes due 2019 ....................... 380.6 416.9 378.8 421.5
8.875% sterling senior notes due 2019 .......................... 345.2 378.9 344.8 397.7
6.50% U.S. dollar senior secured notes due 2018 .................. 635.4 663.5 632.3 677.5
7.00% sterling senior secured notes due 2018 ..................... 864.5 923.1 863.1 925.3
5.25% U.S. dollar senior secured notes due 2021 .................. 353.1 321.8 0.0 0.0
5.50% sterling senior secured notes due 2021 ..................... 722.4 640.3 0.0 0.0
Floating rate senior loan note due 2012 .......................... 64.3 64.3 64.1 64.1
Other notes due to affiliates ................................... 435.0 435.0 437.7 437.7
Senior credit facility ........................................ 750.0 750.0 1,675.0 1,672.5
Capital leases and other ...................................... 258.3 258.3 246.7 246.7
Concentrations of Credit Risk
Our financial instruments that are exposed to concentrations of credit risk consist primarily of cash, trade
receivables and derivative contracts.
At December 31, 2011 and 2010, we had approximately £282.0 million and £376.0 million, respectively, in
cash and cash equivalents. These cash and cash equivalents are on deposit with major financial institutions and,
as part of our cash management process, we perform regular evaluations of the credit standing of these
institutions using a range of metrics. We have not experienced any losses in cash balances and do not believe we
are exposed to any significant credit risk on our cash balances.
F-107