Virgin Media 2011 Annual Report Download - page 109
Download and view the complete annual report
Please find page 109 of the 2011 Virgin Media annual report below. You can navigate through the pages in the report by either clicking on the pages listed below, or by using the keyword search tool below to find specific information within the annual report.-
 1
1 -
2
-
3
-
4
-
5
-
6
-
7
-
8
-
9
-
10
-
11
-
12
-
13
-
14
-
15
-
16
-
17
-
18
-
19
-
20
-
21
-
22
-
23
-
24
-
25
-
26
-
27
-
28
-
29
-
30
-
31
-
32
-
33
-
34
-
35
-
36
-
37
-
38
-
39
-
40
-
41
-
42
-
43
-
44
-
45
-
46
-
47
-
48
-
49
-
50
-
51
-
52
-
53
-
54
-
55
-
56
-
57
-
58
-
59
-
60
-
61
-
62
-
63
-
64
-
65
-
66
-
67
-
68
-
69
-
70
-
71
-
72
-
73
-
74
-
75
-
76
-
77
-
78
-
79
-
80
-
81
-
82
-
83
-
84
-
85
-
86
-
87
-
88
-
89
-
90
-
91
-
92
-
93
-
94
-
95
-
96
-
97
-
98
-
 99
99 -
 100
100 -
 101
101 -
 102
102 -
 103
103 -
 104
104 -
 105
105 -
 106
106 -
 107
107 -
 108
108 -
 109
109 -
 110
110 -
 111
111 -
 112
112 -
 113
113 -
 114
114 -
 115
115 -
 116
116 -
 117
117 -
 118
118 -
 119
119 -
120
-
121
-
122
-
123
-
124
-
125
-
126
-
127
-
128
-
129
-
130
-
131
-
132
-
133
-
134
-
135
-
136
-
137
-
138
-
139
-
140
-
141
-
142
-
143
-
144
-
145
-
146
-
147
-
148
-
149
-
150
-
151
-
152
-
153
-
154
-
155
-
156
-
157
-
158
-
159
-
160
-
161
-
162
-
163
-
164
-
165
-
166
-
167
-
168
-
169
-
170
-
171
-
172
-
173
-
174
-
175
-
176
-
177
-
178
-
179
-
180
-
181
-
182
-
183
-
184
-
185
-
186
-
187
-
188
-
189
-
190
-
191
-
192
-
193
-
194
-
195
-
196
-
197
-
198
-
199
-
200
-
201
-
202
-
203
-
204
-
205
-
206
-
207
-
208
-
209
-
210
-
211
-
212
-
213
-
214
-
215
-
216
-
217
-
218
 |
 |

VIRGIN MEDIA INC. AND SUBSIDIARIES
NOTES TO CONSOLIDATED FINANCIAL STATEMENTS (continued)
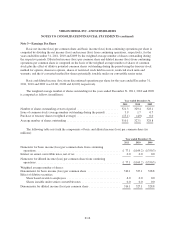
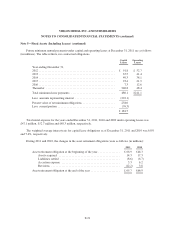
Note 5—Fixed Assets (Including Leases)
Fixed assets consist of (in millions):
December 31,
2011 2010
Useful Life Total
Under Capital
Leases Total
Under Capital
Leases
Operating equipment
Cable distribution plant ............. 5-30 years £ 6,763.7 £ 28.8 £ 6,621.5 £ 28.8
Switches and headends ............. 3-10 years 905.9 19.8 835.0 36.7
Customer premises equipment ....... 5-10 years 1,231.8 254.4 1,175.8 170.1
Other operating equipment .......... 4-20 years 8.8 0.0 21.7 0.0
Total operating equipment .......... 8,910.2 303.0 8,654.0 235.6
Other equipment
Land ........................... — 8.8 0.0 8.8 0.0
Buildings ........................ 20-50 years 100.9 35.8 99.9 35.6
Leasehold improvements ........... 7years or, if
less, the
lease term 115.1 0.0 117.2 0.0
Computer infrastructure ............ 3-5years 241.5 30.1 241.8 44.5
Other equipment .................. 5-10 years 249.7 22.2 240.2 27.9
Total other equipment .............. 716.0 88.1 707.9 108.0
9,626.2 391.1 9,361.9 343.6
Accumulated depreciation ............... (5,145.6) (151.2) (4,714.5) (121.2)
4,480.6 239.9 4,647.4 222.4
Construction in progress ................ 122.1 0.0 115.7 0.0
£ 4,602.7 £ 239.9 £ 4,763.1 £ 222.4
During the years ended December 31, 2011, 2010 and 2009, the assets acquired under capital leases totaled
£91.2 million, £132.2 million and £34.4 million, respectively. Amortization expense on capital leases is included
as a component of depreciation expense.
Included in assets acquired under capital leases for the year ended December 31, 2011 is £55.5 million in
respect to customer premise equipment converted from operating leases to capital leases. Included in assets
acquired under capital leases for the year ended December 31, 2010 is £35.8 million in respect to 42 properties
included in a sale and leaseback transaction.
F-20