Virgin Media 2011 Annual Report Download - page 67
Download and view the complete annual report
Please find page 67 of the 2011 Virgin Media annual report below. You can navigate through the pages in the report by either clicking on the pages listed below, or by using the keyword search tool below to find specific information within the annual report.-
 1
1 -
2
-
3
-
4
-
5
-
6
-
7
-
8
-
9
-
10
-
11
-
12
-
13
-
14
-
15
-
16
-
17
-
18
-
19
-
20
-
21
-
22
-
23
-
24
-
25
-
26
-
27
-
28
-
29
-
30
-
31
-
32
-
33
-
34
-
35
-
36
-
37
-
38
-
39
-
40
-
41
-
42
-
43
-
44
-
45
-
46
-
47
-
48
-
49
-
50
-
51
-
52
-
53
-
54
-
55
-
56
-
 57
57 -
 58
58 -
 59
59 -
 60
60 -
 61
61 -
 62
62 -
 63
63 -
 64
64 -
 65
65 -
 66
66 -
 67
67 -
 68
68 -
 69
69 -
 70
70 -
 71
71 -
 72
72 -
 73
73 -
 74
74 -
 75
75 -
 76
76 -
 77
77 -
78
-
79
-
80
-
81
-
82
-
83
-
84
-
85
-
86
-
87
-
88
-
89
-
90
-
91
-
92
-
93
-
94
-
95
-
96
-
97
-
98
-
99
-
100
-
101
-
102
-
103
-
104
-
105
-
106
-
107
-
108
-
109
-
110
-
111
-
112
-
113
-
114
-
115
-
116
-
117
-
118
-
119
-
120
-
121
-
122
-
123
-
124
-
125
-
126
-
127
-
128
-
129
-
130
-
131
-
132
-
133
-
134
-
135
-
136
-
137
-
138
-
139
-
140
-
141
-
142
-
143
-
144
-
145
-
146
-
147
-
148
-
149
-
150
-
151
-
152
-
153
-
154
-
155
-
156
-
157
-
158
-
159
-
160
-
161
-
162
-
163
-
164
-
165
-
166
-
167
-
168
-
169
-
170
-
171
-
172
-
173
-
174
-
175
-
176
-
177
-
178
-
179
-
180
-
181
-
182
-
183
-
184
-
185
-
186
-
187
-
188
-
189
-
190
-
191
-
192
-
193
-
194
-
195
-
196
-
197
-
198
-
199
-
200
-
201
-
202
-
203
-
204
-
205
-
206
-
207
-
208
-
209
-
210
-
211
-
212
-
213
-
214
-
215
-
216
-
217
-
218
 |
 |

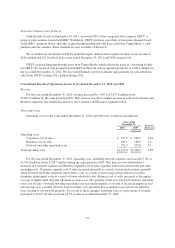
Revenue
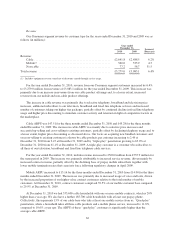
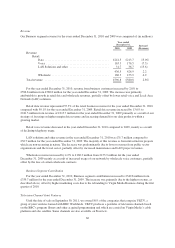
Our Business segment revenue for the years ended December 31, 2010 and 2009 was comprised of (in millions):
Year ended
December 31, Increase/
(Decrease)2010 2009
Revenue:
Retail:
Data ............................................ £241.5 £213.7 13.0%
Voice ........................................... 163.3 176.5 (7.5)
LAN Solutions and other ........................... 31.7 36.7 (13.6)
436.5 426.9 2.2
Wholesale ....................................... 160.3 153.9 4.2
Total revenue ............................................ £596.8 £580.8 2.8%
For the year ended December 31, 2010, revenue from business customers increased by 2.8% to
£596.8 million from £580.8 million for the year ended December 31, 2009. The increase was primarily
attributable to growth in retail data and wholesale revenues, partially offset by lower retail voice and Local Area
Network (LAN) solutions.
Retail data revenue represented 55.3% of the retail business revenue for the year ended December 31, 2010
compared with 50.1% for the year ended December 31, 2009. Retail data revenue increased by 13.0% to
£241.5 million from revenue of £213.7 million for the year ended December 31, 2009 primarily as a result of our
strategy of focusing on higher margin data revenue and increasing demand for our data products within a
growing market.
Retail voice revenue decreased in the year ended December 31, 2010 compared to 2009, mainly as a result
of declining telephony usage.
LAN solutions and other revenue in the year ended December 31, 2010 was £31.7 million compared to
£36.7 million for the year ended December 31, 2009. The majority of this revenue is from infrastructure projects
which are non-recurring in nature. The decrease was predominantly due to lower revenues from public sector
organizations and the travel sector, partially offset by increased maintenance and LAN project revenues.
Wholesale revenue increased by 4.2% to £160.3 million from £153.9 million for the year ended
December 31, 2009 mainly as a result of increased usage of our network by wholesale voice customers, partially
offset by the loss of certain wholesale contracts.
Business Segment Contribution
For the year ended December 31, 2010, Business segment contribution increased to £342.8 million from
£339.7 million for the year ended December 31, 2009. The increase was primarily due to the higher revenue, as
described above, offset by higher marketing costs due to the rebranding to Virgin Media Business during the first
quarter of 2010.
Television Channel Joint Ventures
Until the date of sale on September 30, 2011, we owned 50% of the companies that comprise UKTV, a
group of joint ventures formed with BBC Worldwide. UKTV produces a portfolio of television channels based
on the BBC’s program library and other acquired programming and which are carried on Virgin Media’s cable
platform and also satellite. Some channels are also available on Freeview.
66