Virgin Media 2011 Annual Report Download - page 56
Download and view the complete annual report
Please find page 56 of the 2011 Virgin Media annual report below. You can navigate through the pages in the report by either clicking on the pages listed below, or by using the keyword search tool below to find specific information within the annual report.-
 1
1 -
2
-
3
-
4
-
5
-
6
-
7
-
8
-
9
-
10
-
11
-
12
-
13
-
14
-
15
-
16
-
17
-
18
-
19
-
20
-
21
-
22
-
23
-
24
-
25
-
26
-
27
-
28
-
29
-
30
-
31
-
32
-
33
-
34
-
35
-
36
-
37
-
38
-
39
-
40
-
41
-
42
-
43
-
44
-
45
-
 46
46 -
 47
47 -
 48
48 -
 49
49 -
 50
50 -
 51
51 -
 52
52 -
 53
53 -
 54
54 -
 55
55 -
 56
56 -
 57
57 -
 58
58 -
 59
59 -
 60
60 -
 61
61 -
 62
62 -
 63
63 -
 64
64 -
 65
65 -
 66
66 -
67
-
68
-
69
-
70
-
71
-
72
-
73
-
74
-
75
-
76
-
77
-
78
-
79
-
80
-
81
-
82
-
83
-
84
-
85
-
86
-
87
-
88
-
89
-
90
-
91
-
92
-
93
-
94
-
95
-
96
-
97
-
98
-
99
-
100
-
101
-
102
-
103
-
104
-
105
-
106
-
107
-
108
-
109
-
110
-
111
-
112
-
113
-
114
-
115
-
116
-
117
-
118
-
119
-
120
-
121
-
122
-
123
-
124
-
125
-
126
-
127
-
128
-
129
-
130
-
131
-
132
-
133
-
134
-
135
-
136
-
137
-
138
-
139
-
140
-
141
-
142
-
143
-
144
-
145
-
146
-
147
-
148
-
149
-
150
-
151
-
152
-
153
-
154
-
155
-
156
-
157
-
158
-
159
-
160
-
161
-
162
-
163
-
164
-
165
-
166
-
167
-
168
-
169
-
170
-
171
-
172
-
173
-
174
-
175
-
176
-
177
-
178
-
179
-
180
-
181
-
182
-
183
-
184
-
185
-
186
-
187
-
188
-
189
-
190
-
191
-
192
-
193
-
194
-
195
-
196
-
197
-
198
-
199
-
200
-
201
-
202
-
203
-
204
-
205
-
206
-
207
-
208
-
209
-
210
-
211
-
212
-
213
-
214
-
215
-
216
-
217
-
218
 |
 |

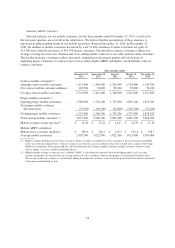
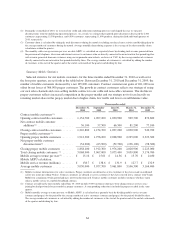
Summary Non-cable Statistics
Selected statistics for our residential customers that are not connected directly through our cable network, or
non-cable customers, for the three months ended December 31, 2011 as well as for the four prior quarters, are set
forth in the table below. We believe that the presentation of these statistics is important in understanding trends
in our non-cable operations. Total non-cable products decreased by 34,000 during the year ended December 31,
2011, primarily due to increased competition in the market.
Three months ended
December 31,
2011
September 30,
2011
June 30,
2011
March 31,
2011
December 31,
2010
Opening customers ....................... 261,300 266,400 272,700 276,700 274,000
Net customer (disconnections) additions ...... (13,100) (5,100) (6,300) (4,000) 2,700
Closing customers ........................ 248,200 261,300 266,400 272,700 276,700
Opening Non-cable products:
Telephone .......................... 169,700 169,000 170,700 169,600 161,200
Broadband .......................... 260,700 265,900 271,400 275,900 273,100
430,400 434,900 442,100 445,500 434,300
Net Non-cable product (disconnections)
additions:
Telephone .......................... (6,400) 700 (1,700) 1,100 8,400
Broadband .......................... (12,500) (5,200) (5,500) (4,500) 2,800
(18,900) (4,500) (7,200) (3,400) 11,200
Closing Non-cable products:
Telephone .......................... 163,300 169,700 169,000 170,700 169,600
Broadband .......................... 248,200 260,700 265,900 271,400 275,900
411,500 430,400 434,900 442,100 445,500
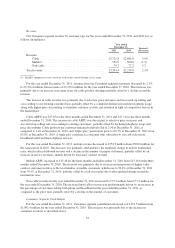
Business Segment
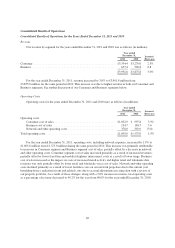
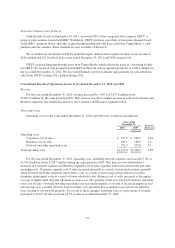
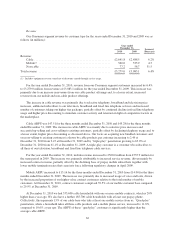
The summary combined results of operations of our Business segment for the years ended December 31,
2011 and 2010 were as follows (in millions):
Year ended
December 31, Increase/
(Decrease)2011 2010
Revenue .......................................................... £637.4 £596.8 6.8%
Segment contribution ............................................... 377.4 342.8 10.1
55