Tesco 2011 Annual Report Download - page 91
Download and view the complete annual report
Please find page 91 of the 2011 Tesco annual report below. You can navigate through the pages in the report by either clicking on the pages listed below, or by using the keyword search tool below to find specific information within the annual report.-
 1
1 -
2
-
3
-
4
-
5
-
6
-
7
-
8
-
9
-
10
-
11
-
12
-
13
-
14
-
15
-
16
-
17
-
18
-
19
-
20
-
21
-
22
-
23
-
24
-
25
-
26
-
27
-
28
-
29
-
30
-
31
-
32
-
33
-
34
-
35
-
36
-
37
-
38
-
39
-
40
-
41
-
42
-
43
-
44
-
45
-
46
-
47
-
48
-
49
-
50
-
51
-
52
-
53
-
54
-
55
-
56
-
57
-
58
-
59
-
60
-
61
-
62
-
63
-
64
-
65
-
66
-
67
-
68
-
69
-
70
-
71
-
72
-
73
-
74
-
75
-
76
-
77
-
78
-
79
-
80
-
 81
81 -
 82
82 -
 83
83 -
 84
84 -
 85
85 -
 86
86 -
 87
87 -
 88
88 -
 89
89 -
 90
90 -
 91
91 -
 92
92 -
 93
93 -
 94
94 -
 95
95 -
 96
96 -
 97
97 -
 98
98 -
 99
99 -
 100
100 -
 101
101 -
102
-
103
-
104
-
105
-
106
-
107
-
108
-
109
-
110
-
111
-
112
-
113
-
114
-
115
-
116
-
117
-
118
-
119
-
120
-
121
-
122
-
123
-
124
-
125
-
126
-
127
-
128
-
129
-
130
-
131
-
132
-
133
-
134
-
135
-
136
-
137
-
138
-
139
-
140
-
141
-
142
-
143
-
144
-
145
-
146
-
147
-
148
-
149
-
150
-
151
-
152
-
153
-
154
-
155
-
156
-
157
-
158
-
159
-
160
-
161
-
162
 |
 |

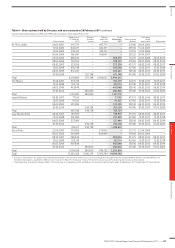
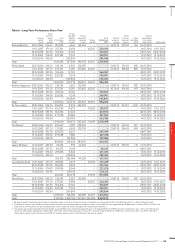
Table 4 – Share options held by Directors and not exercised at 26 February 2011 continued
Executive Share Option Scheme (1994) and (1996) and Discretionary Share Option Plan (2004)
Date of grant
Options as at
27 February
2010
Options
granted
in year1
Options
exercised
in year2
As at
26 February
2011
Exercise price
(pence)
Date from
which
exercisable Expiry date
Sir Terry Leahy 26.04.2001 647,773 – 647,773 –247.00 26.04.2004 –
15.04.2002 642,471 – 642,471 –259.00 15.04.2005 –
14.04.2003 939,747 – 939,747 –197.50 14.04.2006 –
30.04.2004 766,041 – 766,041 –253.25 30.04.2007 –
22.04.2005 658,673 – – 658,673 312.75 22.04.2008 22.04.2015
08.05.2006 709,353 – – 709,353 318.60 08.05.2009 08.05.2016
08.05.2007 523,556 – – 523,556 473.75 08.05.2010 08.05.2017
12.05.2008 618,548 – – 618,548 427.00 12.05.2011 12.05.2018
06.05.2009 812,647 – – 812,647 338.40 06.05.2012 06.05.2019
07.05.2010 – 671,748 – 671,748 419.80 07.05.2013 07.05.2020
Total 6,318,809 671,748 2,996,032 3,994,525
Tim Mason 10.08.2007 333,319 – – 333,319 424.75 10.08.2010 10.08.2017
12.05.2008 353,114 – – 353,114 427.00 12.05.2011 12.05.2018
06.05.2009 467,848 – – 467,848 338.40 06.05.2012 06.05.2019
07.05.2010 – 386,850 – 386,850 419.80 07.05.2013 07.05.2020
Total 1,154,281 386,850 – 1,541,131
Laurie McIlwee 08.05.2007 77,192 – – 77,192 473.75 08.05.2010 08.05.2017
12.05.2008 91,335 – – 91,335 427.00 12.05.2011 12.05.2018
06.05.2009 325,059 – – 325,059 338.40 06.05.2012 06.05.2019
07.05.2010 – 290,138 – 290,138 419.80 07.05.2013 07.05.2020
Total 493,586 290,138 – 783,724
Lucy Neville-Rolfe 08.05.2007 189,973 – – 189,973 473.75 08.05.2010 08.05.2017
12.05.2008 231,850 – – 231,850 427.00 12.05.2011 12.05.2018
06.05.2009 327,494 – – 327,494 338.40 06.05.2012 06.05.2019
07.05.2010 – 290,138 – 290,138 419.80 07.05.2013 07.05.2020
Total 749,317 290,138 – 1,039,455
David Potts 22.04.2005 379,856 – 379,856 –312.75 22.04.2008 –
08.05.2006 404,896 – 404,896 –318.60 08.05.2009 –
08.05.2007 298,844 – – 298,844 473.75 08.05.2010 08.05.2017
12.05.2008 353,114 – – 353,114 427.00 12.05.2011 12.05.2018
06.05.2009 467,848 – – 467,848 338.40 06.05.2012 06.05.2019
07.05.2010 – 386,850 – 386,850 419.80 07.05.2013 07.05.2020
Total 1,904,558 386,850 784,752 1,506,656
Total 15,529,256 3,186,274 3,780,784 14,934,746
1 Executive share options are subject to performance conditions measured over three years as set out on page 83. EPS growth for the period 2008/9 to 2010/11 exceeded RPI by 32%,
therefore share options awarded in 2008 will vest in full on 12 May 2011. Executives have until the tenth anniversary of the date of grant to exercise their options.
2 The market price at exercise is shown in table 3. The share price as at 26 February 2011 was 406.5p. The share price during the 52 weeks to 26 February 2011 ranged from 377.5p to 454.4p.
Overview Business review Governance Financial statements
TESCO PLC Annual Report and Financial Statements 2011
—
87