Tesco 2011 Annual Report Download - page 25
Download and view the complete annual report
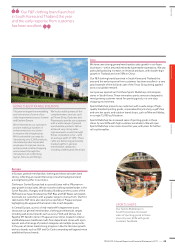
Please find page 25 of the 2011 Tesco annual report below. You can navigate through the pages in the report by either clicking on the pages listed below, or by using the keyword search tool below to find specific information within the annual report.-
 1
1 -
2
-
3
-
4
-
5
-
6
-
7
-
8
-
9
-
10
-
11
-
12
-
13
-
14
-
 15
15 -
 16
16 -
 17
17 -
 18
18 -
 19
19 -
 20
20 -
 21
21 -
 22
22 -
 23
23 -
 24
24 -
 25
25 -
 26
26 -
 27
27 -
 28
28 -
 29
29 -
 30
30 -
 31
31 -
 32
32 -
 33
33 -
 34
34 -
 35
35 -
36
-
37
-
38
-
39
-
40
-
41
-
42
-
43
-
44
-
45
-
46
-
47
-
48
-
49
-
50
-
51
-
52
-
53
-
54
-
55
-
56
-
57
-
58
-
59
-
60
-
61
-
62
-
63
-
64
-
65
-
66
-
67
-
68
-
69
-
70
-
71
-
72
-
73
-
74
-
75
-
76
-
77
-
78
-
79
-
80
-
81
-
82
-
83
-
84
-
85
-
86
-
87
-
88
-
89
-
90
-
91
-
92
-
93
-
94
-
95
-
96
-
97
-
98
-
99
-
100
-
101
-
102
-
103
-
104
-
105
-
106
-
107
-
108
-
109
-
110
-
111
-
112
-
113
-
114
-
115
-
116
-
117
-
118
-
119
-
120
-
121
-
122
-
123
-
124
-
125
-
126
-
127
-
128
-
129
-
130
-
131
-
132
-
133
-
134
-
135
-
136
-
137
-
138
-
139
-
140
-
141
-
142
-
143
-
144
-
145
-
146
-
147
-
148
-
149
-
150
-
151
-
152
-
153
-
154
-
155
-
156
-
157
-
158
-
159
-
160
-
161
-
162
 |
 |

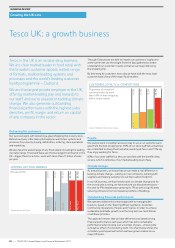
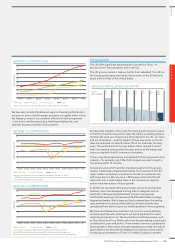
Revenue £bn
00/0198/99 02/03 06/0704/05 08/09 10/1196/97
40
35
25
20
30
15
10
5
Asda J Sainsbury TescoWm Morrison
GROWTH vs COMPETITORS
Source: Tesco and Deutsche Bank Research (including estimates for 10/11).
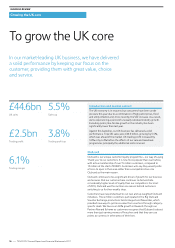
We have also consistently delivered superior financial performance to
our peers in terms of profit margin and return on capital, which in turn
has helped us invest in our customer offer and in further expansion
– new stores, new businesses (e.g. banking and telecoms), new
channels (e.g tesco.com) and new countries.
EBITDAR margin %
02/0301/02 03/04 04/05 06/0705/06 08/0907/08 09/10 10/1100/01
12
10
8
6
4
2
J Sainsbury Tesco UKWm Morrison
EBITDAR* vs COMPETITORS
Source: Tesco and Deutsche Bank Research (including estimates for 10/11).
* EBITDAR defined as statutory profit before interest, tax, depreciation, amortisation and rent.
Tesco EBITDAR excludes property profits.
J Sainsbury Tesco UKWm Morrison
ROCE %
02/0301/02 03/04 04/05 06/0705/06 08/0907/08 09/10 10/1100/01
20
15
10
5
0
-5
UK ROCE vs COMPETITORS
Source: Tesco and Deutsche Bank Research (including estimates for 10/11).
Tesco ROCE excludes the positive impact of the sale and leaseback programme.
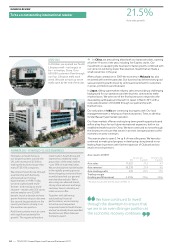
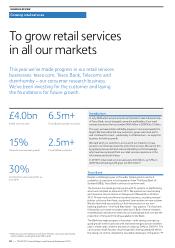
Future growth
The UK offers significant opportunities for growth for Tesco – in
grocery, in non-food categories and in services.
The UK grocery market is mature, but far from saturated. The UK has
the lowest grocery space per capita of any country in the EU and only
about a third of that of the United States.
0.25
0.21
0.29
0.28
Spain
Poland
0.34
Germany
0.35
0.35
Italy
France
0.58
US
UK
Netherlands
sq m
per capita
GROCERY RETAIL SPACE PER CAPITA
Source: Verdict Research (space per capita), Economist Intelligence Unit (population data).
An important indicator of the scope for future growth of grocery space
in the UK is that when new stores open the impact on existing stores is
minimal. We track very closely every store opened in the UK – by Tesco
and our competitors – and the impact of these new stores on Tesco’s
sales has remained consistently below 1% of our total sales for many
years. The performance of our own mature stores opened in recent
years is exceeding business plan forecasts and our profit margin and
return on capital in the UK continue to strengthen.
There is significant opportunity and demand for Tesco to grow its store
network – for example, only 54% of UK shoppers are able to reach a
Tesco Extra within 15 minutes.
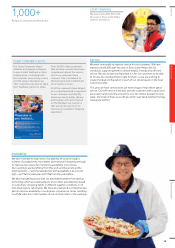
Convenience stores form another important segment of the grocery
market. Traditionally a fragmented market, Tesco was the first of the
major retailers to develop a convenience format on a national scale
with Tesco Express. We now have 1,285 Express stores but this still
represents only a small market share in the convenience segment
and we have many years of future growth.
In addition to food (and other grocery items such as household and
toiletries), Tesco has developed a strong offer in categories such as
electricals, clothing and entertainment. In these ‘new’ general
merchandise areas we only have around a 4% market share in a large
fragmented market. With a large and loyal customer base, the leading
store network and a strong online platform, we have a tremendous
springboard from which to grow our market positions in these segments.
We have also followed our customers into services such as banking,
insurance and telecoms, building on our brand reputation for value,
simplicity and great service. We have built successful businesses, such
as Tesco Bank and Tesco Mobile, which are already making a significant
contribution to sales and profits. There remains enormous potential for
future growth in these areas, through expanding our range of products
(particularly in banking with mortgages and current accounts) and by
increasing our penetration of Tesco’s 15 million Clubcard customers.
TESCO PLC Annual Report and Financial Statements 2011
—
21
Overview Business review Governance Financial statements
NB: some versions of the printed Annual Report show an incorrect version of this chart.