Tesco 2011 Annual Report Download - page 144
Download and view the complete annual report
Please find page 144 of the 2011 Tesco annual report below. You can navigate through the pages in the report by either clicking on the pages listed below, or by using the keyword search tool below to find specific information within the annual report.-
 1
1 -
2
-
3
-
4
-
5
-
6
-
7
-
8
-
9
-
10
-
11
-
12
-
13
-
14
-
15
-
16
-
17
-
18
-
19
-
20
-
21
-
22
-
23
-
24
-
25
-
26
-
27
-
28
-
29
-
30
-
31
-
32
-
33
-
34
-
35
-
36
-
37
-
38
-
39
-
40
-
41
-
42
-
43
-
44
-
45
-
46
-
47
-
48
-
49
-
50
-
51
-
52
-
53
-
54
-
55
-
56
-
57
-
58
-
59
-
60
-
61
-
62
-
63
-
64
-
65
-
66
-
67
-
68
-
69
-
70
-
71
-
72
-
73
-
74
-
75
-
76
-
77
-
78
-
79
-
80
-
81
-
82
-
83
-
84
-
85
-
86
-
87
-
88
-
89
-
90
-
91
-
92
-
93
-
94
-
95
-
96
-
97
-
98
-
99
-
100
-
101
-
102
-
103
-
104
-
105
-
106
-
107
-
108
-
109
-
110
-
111
-
112
-
113
-
114
-
115
-
116
-
117
-
118
-
119
-
120
-
121
-
122
-
123
-
124
-
125
-
126
-
127
-
128
-
129
-
130
-
131
-
132
-
133
-
 134
134 -
 135
135 -
 136
136 -
 137
137 -
 138
138 -
 139
139 -
 140
140 -
 141
141 -
 142
142 -
 143
143 -
 144
144 -
 145
145 -
 146
146 -
 147
147 -
 148
148 -
 149
149 -
 150
150 -
 151
151 -
 152
152 -
 153
153 -
 154
154 -
155
-
156
-
157
-
158
-
159
-
160
-
161
-
162
 |
 |

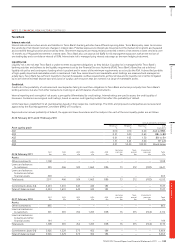
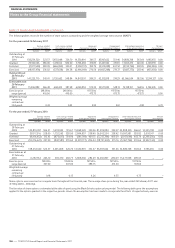
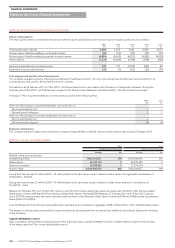
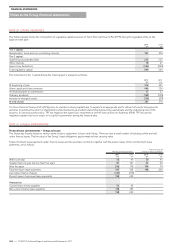
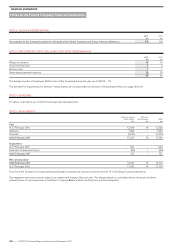
NOTE 28 POST-EMPLOYMENT BENEFITS CONTINUED
History of movements
The historical movement in defined benefit pension schemes’ assets and liabilities and history of experience gains and losses are as follows:
2011
£m
2010
£m
2009
£m
2008
£m
2007
£m
Total market value of assets 5,608 4,696 3,420 4,089 4,007
Present value of liabilities relating to unfunded schemes (65) (54) (39) (34) (27)
Present value of liabilities relating to partially funded schemes (6,899) (6,482) (4,875) (4,893) (4,930)
Pension deficit (1,356) (1,840) (1,494) (838) (950)
Experience gains/(losses) on scheme assets 278 733 (1,270) (465) 82
Experience losses on plan liabilities (25) (1) (117) (20) (41)
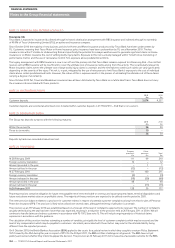
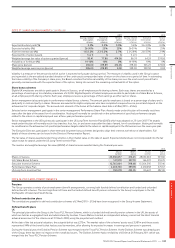
Post-employment benefits other than pensions
The Company operates a scheme offering post-employment healthcare benefits. The cost of providing these benefits has been accounted for on
a similar basis to that used for defined benefit pension schemes.
The liability as at 26 February 2011 of £12m (2010 – £12m) was determined in accordance with the advice of independent actuaries. During the
financial year, £0.8m (2010 – £0.7m) has been charged to the Group Income Statement and £0.6m (2010 – £0.5m) of benefits were paid.
A change of 1% in assumed healthcare cost trend rates would have the following effect:
2011
£m
2010
£m
Effect of a 1% increase in assumed healthcare cost trend rate on:
Service and interest cost – –
Defined benefit obligation 2 2
Effect of a 1% decrease in assumed healthcare cost trend rate on:
Service and interest cost ––
Defined benefit obligation (1) (2)
Expected contributions
The Company expects to make cash contributions of approximately £440m to defined schemes in the financial year ending 25 February 2012.
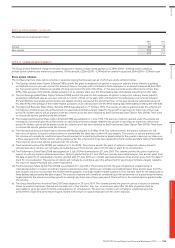
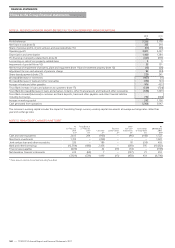
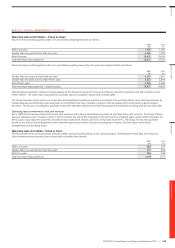
NOTE 29 CALLED UP SHARE CAPITAL
2011 2010
Ordinary shares of 5p each Ordinary shares of 5p each
Number £m Number £m
Allotted, called up and fully paid:
At beginning of year 7,985,044,057 399 7,895,344,018 395
Share options 36,535,102 2 62,329,535 3
Share bonus awards 24,888,933 1 27,370,504 1
At end of year 8,046,468,092 402 7,985,044,057 399
During the financial year, 37 million (2010 – 62 million) shares of 5p each were issued in relation to share options for aggregate consideration of
£97m (2010 – £166m).
During the financial year, 25 million (2010 – 27 million) shares of 5p each were issued in relation to share bonus awards for consideration of
£1m (2010 – £1m).
Between 27 February 2011 and 15 April 2011 options over 2,137,647 ordinary shares have been exercised under the terms of the Savings-related
Share Option Scheme (1981) and the Irish Savings-related Share Option Scheme (2000). Between 27 February 2011 and 15 April 2011, options
over 1,020,924 ordinary shares have been exercised under the terms of the Executive Share Option Schemes (1994 and 1996) and the Discretionary
Share Option Plan (2004).
As at 26 February 2011, the Directors were authorised to purchase up to a maximum in aggregate of 802.1 million (2010 – 790.1 million) ordinary shares.
The owners of ordinary shares are entitled to receive dividends as declared from time to time and are entitled to one vote per share at the meetings
of the Company.
Capital redemption reserve
Upon cancellation of the shares purchased as part of the share buy-back, a capital redemption reserve is created representing the nominal value
of the shares cancelled. This is a non-distributable reserve.
FINANCIAL STATEMENTS
140
—
TESCO PLC Annual Report and Financial Statements 2011
Notes to the Group financial statements