Tesco 2011 Annual Report Download - page 137
Download and view the complete annual report
Please find page 137 of the 2011 Tesco annual report below. You can navigate through the pages in the report by either clicking on the pages listed below, or by using the keyword search tool below to find specific information within the annual report.-
 1
1 -
2
-
3
-
4
-
5
-
6
-
7
-
8
-
9
-
10
-
11
-
12
-
13
-
14
-
15
-
16
-
17
-
18
-
19
-
20
-
21
-
22
-
23
-
24
-
25
-
26
-
27
-
28
-
29
-
30
-
31
-
32
-
33
-
34
-
35
-
36
-
37
-
38
-
39
-
40
-
41
-
42
-
43
-
44
-
45
-
46
-
47
-
48
-
49
-
50
-
51
-
52
-
53
-
54
-
55
-
56
-
57
-
58
-
59
-
60
-
61
-
62
-
63
-
64
-
65
-
66
-
67
-
68
-
69
-
70
-
71
-
72
-
73
-
74
-
75
-
76
-
77
-
78
-
79
-
80
-
81
-
82
-
83
-
84
-
85
-
86
-
87
-
88
-
89
-
90
-
91
-
92
-
93
-
94
-
95
-
96
-
97
-
98
-
99
-
100
-
101
-
102
-
103
-
104
-
105
-
106
-
107
-
108
-
109
-
110
-
111
-
112
-
113
-
114
-
115
-
116
-
117
-
118
-
119
-
120
-
121
-
122
-
123
-
124
-
125
-
126
-
 127
127 -
 128
128 -
 129
129 -
 130
130 -
 131
131 -
 132
132 -
 133
133 -
 134
134 -
 135
135 -
 136
136 -
 137
137 -
 138
138 -
 139
139 -
 140
140 -
 141
141 -
 142
142 -
 143
143 -
 144
144 -
 145
145 -
 146
146 -
 147
147 -
148
-
149
-
150
-
151
-
152
-
153
-
154
-
155
-
156
-
157
-
158
-
159
-
160
-
161
-
162
 |
 |

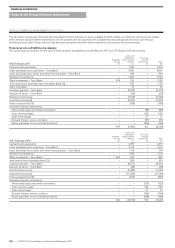
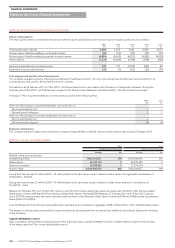
NOTE 23 FINANCIAL RISK FACTORS CONTINUED
Tesco Bank
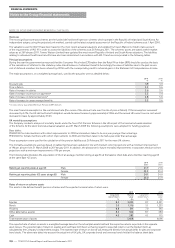
Interest rate risk
Interest rate risk arises where assets and liabilities in Tesco Bank’s banking activities have different repricing dates. Tesco Bank policy seeks to minimise
the sensitivity of net interest income to changes in interest rates. Potential exposures to interest rate movements in the medium to long term are measured
and controlled through position and sensitivity limits. Short-term exposures are measured and controlled in terms of net interest income sensitivity over
12 months to a 1% parallel movement in interest rates. Tesco Bank also use value at risk (VaR) for risk management purposes with a time horizon of
one trading day and a confidence interval of 95%. Interest rate risk is managed using interest rate swaps as the main hedging instrument.
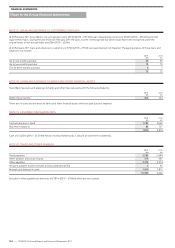
Liquidity risk
Liquidity risk is the risk that Tesco Bank is unable to meet its payment obligations as they fall due. Liquidity risk is managed within Tesco Bank’s
banking activities and adheres to the liquidity requirements set by the Financial Services Authority (FSA). Tesco Bank’s Board has set a defined
liquidity risk policy and contingency funding which is prudent and in excess of the minimum requirements as set out by the FSA. A diversified portfolio
of high-quality liquid and marketable assets is maintained. Cash flow commitments and marketable asset holdings are measured and managed on
a daily basis. Tesco Bank has sufficient liquidity to meet all foreseeable outflow requirements as they fall due and its liquidity risk is further mitigated
by its well diversified retail deposit base and a pool of surplus cash resources that are invested in a range of marketable assets.
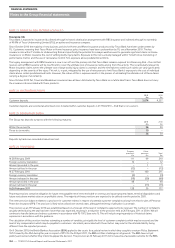
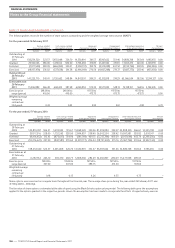
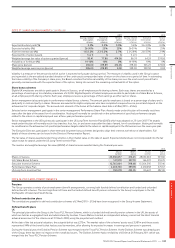
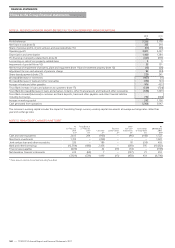
Credit risk
Credit risk is the probability of customers and counterparties failing to meet their obligations to Tesco Bank and arises principally from Tesco Bank’s
lending activities, but also from other transactions involving on and off-balance sheet instruments.
Internal reporting and oversight of risk assets is principally differentiated by credit ratings. Internal ratings are used to assess the credit quality of
borrowers. Customers are assigned credit ratings, based on various credit grading models that reflect the probability of default.
Limits have been established for all counterparties based on their respective credit ratings. The limits and proposed counterparties are reviewed and
approved by the Risk Management Committee (RMC) of Tesco Bank.
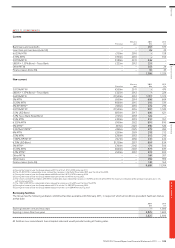
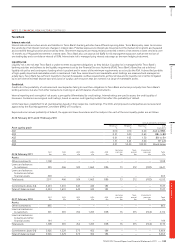
Expressed as an annual probability of default, the upper and lower boundaries and the midpoint for each of the asset quality grades are as follows:
At 26 February 2011 and 27 February 2010
Annual probability of default
Asset quality grade Minimum
%
Midpoint
%
Maximum
%
S&P
equivalent
AQ1 0.00 0.10 0.20 AAA to BBB-
AQ2 0.21 0.40 0.60 BB+ to BB
AQ3 0.61 1.05 1.50 BB- to B+
AQ4 1.51 3.25 5.00 B+ to B
AQ5 5.01 52.50 100.00 B and below
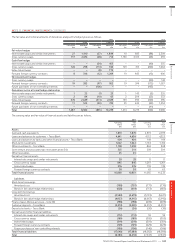
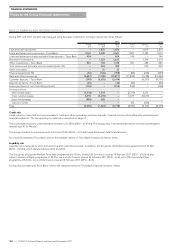
At 26 February 2011 AQ1
£m
AQ2
£m
AQ3
£m
AQ4
£m
AQ5
£m
Accruing
past due
£m
Non-
accrual
£m
Impairment
provision
£m
Total
£m
Assets:
Other investments 1,108 – – – – – – – 1,108
Loans and advances
to customers 599 466 924 1,663 886 73 212 (182) 4,641
Loans and advances
to banks and other
financial assets 404 – – – – – – – 404
Total assets 2,111 466 924 1,663 886 73 212 (182) 6,153
Commitments (note 34) 4,254 1,601 645 444 183 – – – 7,127
Total off-balance sheet 4,254 1,601 645 444 183 – – – 7,127
At 27 February 2010 AQ1
£m
AQ2
£m
AQ3
£m
AQ4
£m
AQ5
£m
Accruing
past due
£m
Non-
accrual
£m
Impairment
provision
£m
Total
£m
Assets:
Other investments 863 – – – – – – – 863
Loans and advances
to customers 501 381 762 1,495 838 76 373 (314) 4,112
Loans and advances
to banks and other
financial assets 144 – – – – – – – 144
Total assets 1,508 381 762 1,495 838 76 373 (314) 5,119
Commitments (note 34) 3,926 1,329 573 452 184 – – – 6,464
Total off-balance sheet 3,926 1,329 573 452 184 – – – 6,464
Overview Business review Governance Financial statements
TESCO PLC Annual Report and Financial Statements 2011
—
133