Tesco 2011 Annual Report Download - page 125
Download and view the complete annual report
Please find page 125 of the 2011 Tesco annual report below. You can navigate through the pages in the report by either clicking on the pages listed below, or by using the keyword search tool below to find specific information within the annual report.-
 1
1 -
2
-
3
-
4
-
5
-
6
-
7
-
8
-
9
-
10
-
11
-
12
-
13
-
14
-
15
-
16
-
17
-
18
-
19
-
20
-
21
-
22
-
23
-
24
-
25
-
26
-
27
-
28
-
29
-
30
-
31
-
32
-
33
-
34
-
35
-
36
-
37
-
38
-
39
-
40
-
41
-
42
-
43
-
44
-
45
-
46
-
47
-
48
-
49
-
50
-
51
-
52
-
53
-
54
-
55
-
56
-
57
-
58
-
59
-
60
-
61
-
62
-
63
-
64
-
65
-
66
-
67
-
68
-
69
-
70
-
71
-
72
-
73
-
74
-
75
-
76
-
77
-
78
-
79
-
80
-
81
-
82
-
83
-
84
-
85
-
86
-
87
-
88
-
89
-
90
-
91
-
92
-
93
-
94
-
95
-
96
-
97
-
98
-
99
-
100
-
101
-
102
-
103
-
104
-
105
-
106
-
107
-
108
-
109
-
110
-
111
-
112
-
113
-
114
-
 115
115 -
 116
116 -
 117
117 -
 118
118 -
 119
119 -
 120
120 -
 121
121 -
 122
122 -
 123
123 -
 124
124 -
 125
125 -
 126
126 -
 127
127 -
 128
128 -
 129
129 -
 130
130 -
 131
131 -
 132
132 -
 133
133 -
 134
134 -
 135
135 -
136
-
137
-
138
-
139
-
140
-
141
-
142
-
143
-
144
-
145
-
146
-
147
-
148
-
149
-
150
-
151
-
152
-
153
-
154
-
155
-
156
-
157
-
158
-
159
-
160
-
161
-
162
 |
 |

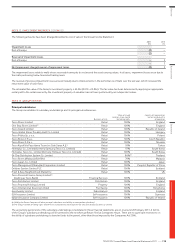
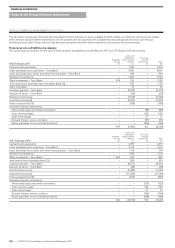
NOTE 13 GROUP ENTITIES CONTINUED
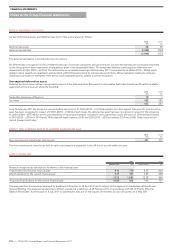
The share of the assets, liabilities, revenue and profit of the joint ventures, which are included in the Group financial statements, are as follows:
2011
£m
2010
£m
Non-current assets 2,720 2,216
Current assets 577 359
Current liabilities (1,957) (411)
Non-current liabilities (1,123) (2,041)
Goodwill 71
Cumulative unrecognised losses –12
224 136
Revenue 369 355
Expenses (304) (326)
Profit for the year 65 29
The unrecognised share of losses made by joint ventures during the financial year was £7m (2010 – £3m).
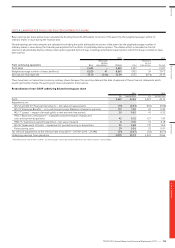
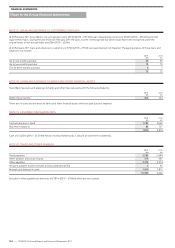
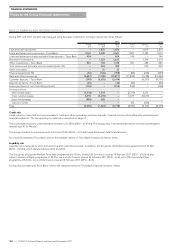
Associates
The Group’s principal associates are:
Business activity
Share of issued share capital,
loan capital and debt
securities
Country of incorporation
and principal country
of operation
Greenergy International Limited* Fuel Supplier 34% England
Tesco Underwriting Limited* Insurance 49.9% England
* Held by an intermediate subsidiary.
On 18 May 2010 the Group acquired an additional 13% of the ordinary share capital of Greenergy International Limited for a cash consideration of £16m,
taking the Group’s holding to 34%.
The share of the assets, liabilities, revenue and profit of the Group’s associates, which are included in the Group financial statements, are as follows:
2011
£m
2010
£m
Assets 535 156
Liabilities (452) (142)
Goodwill 92
92 16
Revenue 1,551 473
(Loss)/profit for the year (8) 4
The accounting period ends of the associates consolidated in these financial statements range from 31 December 2010 to 28 February 2011. The
accounting period end dates of the associates are different from those of the Group as they depend upon the requirements of the parent companies
of those entities.
There are no significant restrictions on the ability of associated undertakings to transfer funds to the parent, other than those imposed by the
Companies Act 2006.
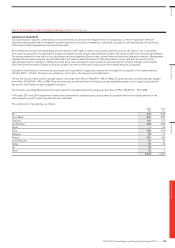
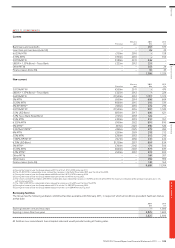
NOTE 14 OTHER INVESTMENTS
2011
£m
2010
£m
Loan receivable 259 259
Available-for-sale financial assets 849 604
1,108 863
The loan receivable comprises an interest-free subordinated loan made by Tesco Bank to Royal Bank of Scotland Insurance Group Limited. This loan
has no interest receivable and no fixed repayment date.
Available-for-sale financial assets comprise investments in bonds and certificates of deposit with varied maturities of which £202m (2010 – £224m)
is current.
Overview Business review Governance Financial statements
TESCO PLC Annual Report and Financial Statements 2011
—
121