Tesco 2011 Annual Report Download - page 129
Download and view the complete annual report
Please find page 129 of the 2011 Tesco annual report below. You can navigate through the pages in the report by either clicking on the pages listed below, or by using the keyword search tool below to find specific information within the annual report.-
 1
1 -
2
-
3
-
4
-
5
-
6
-
7
-
8
-
9
-
10
-
11
-
12
-
13
-
14
-
15
-
16
-
17
-
18
-
19
-
20
-
21
-
22
-
23
-
24
-
25
-
26
-
27
-
28
-
29
-
30
-
31
-
32
-
33
-
34
-
35
-
36
-
37
-
38
-
39
-
40
-
41
-
42
-
43
-
44
-
45
-
46
-
47
-
48
-
49
-
50
-
51
-
52
-
53
-
54
-
55
-
56
-
57
-
58
-
59
-
60
-
61
-
62
-
63
-
64
-
65
-
66
-
67
-
68
-
69
-
70
-
71
-
72
-
73
-
74
-
75
-
76
-
77
-
78
-
79
-
80
-
81
-
82
-
83
-
84
-
85
-
86
-
87
-
88
-
89
-
90
-
91
-
92
-
93
-
94
-
95
-
96
-
97
-
98
-
99
-
100
-
101
-
102
-
103
-
104
-
105
-
106
-
107
-
108
-
109
-
110
-
111
-
112
-
113
-
114
-
115
-
116
-
117
-
118
-
 119
119 -
 120
120 -
 121
121 -
 122
122 -
 123
123 -
 124
124 -
 125
125 -
 126
126 -
 127
127 -
 128
128 -
 129
129 -
 130
130 -
 131
131 -
 132
132 -
 133
133 -
 134
134 -
 135
135 -
 136
136 -
 137
137 -
 138
138 -
 139
139 -
140
-
141
-
142
-
143
-
144
-
145
-
146
-
147
-
148
-
149
-
150
-
151
-
152
-
153
-
154
-
155
-
156
-
157
-
158
-
159
-
160
-
161
-
162
 |
 |

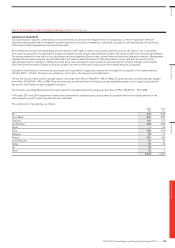
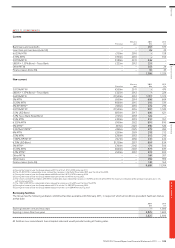
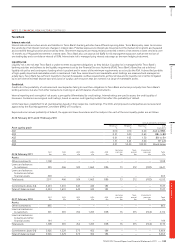
NOTE 21 BORROWINGS
Current
Par value
Maturity
year
2011
£m
2010
£m
Bank loans and overdrafts – – 437 575
Loan from joint ventures (note 30) – – 26 23
6.625% MTN £150m 2010 –158
4.75% MTN €750m 2010 – 704
3.875% MTN €389m 2011 346 –
LIBOR + 1.33% Bond – Tesco Bank £225m 2012 224 –
Other MTNs – – 303 24
Finance leases (note 36) – – 50 45
1,386 1,529
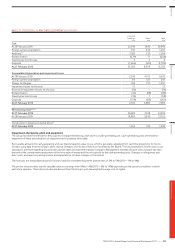
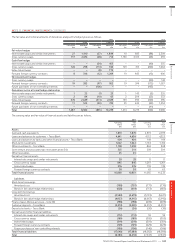
Non-current
Par value
Maturity
year
2011
£m
2010
£m
3.875% MTN(a) €500m 2011 –479
LIBOR + 1.33% Bond – Tesco Bank £225m 2012 –224
5.625% MTN €1,500m 2012 1,317 1,375
5% MTN £600m 2014 606 604
5.125% MTN €600m 2015 510 539
4% RPI MTN(b) £263m 2016 276 270
5.875% MTN(c) €1,500m 2016 997 1,520
5.5% USD Bond $850m 2017 600 621
5.2% Tesco Bank Retail Bond £125m 2018 126 –
5.5% MTN £350m 2019 351 351
6.125% MTN £900m 2022 891 890
5% MTN(d) £515m 2023 390 520
3.322% LPI MTN(e) £265m 2025 279 269
6% MTN £200m 2029 218 212
5.5% MTN £200m 2033 215 210
1.982% RPI MTN(f ) £221m 2036 231 222
6.15% USD Bond $1,150m 2037 804 834
5% MTN(g) £300m 2042 174 306
5.125% MTN €600m 2047 577 587
5.2% MTN(h) £500m 2057 274 500
Other MTNs – – 169 267
Other loans – – 536 780
Finance leases (note 36) – – 148 164
9,689 11,744
(a) During the financial year the Group redeemed €111m of the 3.875% MTN maturing 2011.
(b) The 4% RPI MTN is redeemable at par, indexed for increases in the Retail Price Index (RPI) over the life of the MTN.
(c) During the financial year the Group redeemed €461m of the 5.875% MTN maturing 2016.
(d) During the financial year the Group redeemed £126m of the 5% MTN maturing 2023.
(e) The 3.322% Limited Price Inflation (LPI) MTN is redeemable at par, indexed for increases in the RPI over the life of the MTN. The maximum indexation of the principal in any one year is 5%,
with a minimum of 0%.
(f) The 1.982% RPI MTN is redeemable at par, indexed for increases in the RPI over the life of the MTN.
(g) During the financial year the Group redeemed £127m of the 5% GBP MTN maturing 2042.
(h) During the financial year the Group redeemed £221m of the 5.2% GBP MTN maturing 2057.
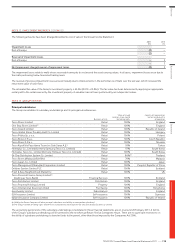
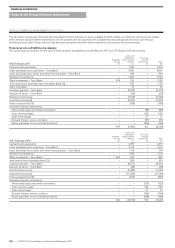
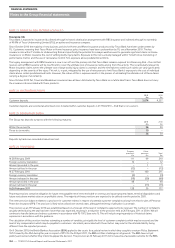
Borrowing facilities
The Group has the following undrawn committed facilities available at 26 February 2011, in respect of which all conditions precedent had been met as
at that date:
2011
£m
2010
£m
Expiring between one and two years –1,000
Expiring in more than two years 2,825 1,600
2,825 2,600
All facilities incur commitment fees at market rates and would provide funding at floating rates.
Overview Business review Governance Financial statements
TESCO PLC Annual Report and Financial Statements 2011
—
125