Tesco 2011 Annual Report Download - page 146
Download and view the complete annual report
Please find page 146 of the 2011 Tesco annual report below. You can navigate through the pages in the report by either clicking on the pages listed below, or by using the keyword search tool below to find specific information within the annual report.-
 1
1 -
2
-
3
-
4
-
5
-
6
-
7
-
8
-
9
-
10
-
11
-
12
-
13
-
14
-
15
-
16
-
17
-
18
-
19
-
20
-
21
-
22
-
23
-
24
-
25
-
26
-
27
-
28
-
29
-
30
-
31
-
32
-
33
-
34
-
35
-
36
-
37
-
38
-
39
-
40
-
41
-
42
-
43
-
44
-
45
-
46
-
47
-
48
-
49
-
50
-
51
-
52
-
53
-
54
-
55
-
56
-
57
-
58
-
59
-
60
-
61
-
62
-
63
-
64
-
65
-
66
-
67
-
68
-
69
-
70
-
71
-
72
-
73
-
74
-
75
-
76
-
77
-
78
-
79
-
80
-
81
-
82
-
83
-
84
-
85
-
86
-
87
-
88
-
89
-
90
-
91
-
92
-
93
-
94
-
95
-
96
-
97
-
98
-
99
-
100
-
101
-
102
-
103
-
104
-
105
-
106
-
107
-
108
-
109
-
110
-
111
-
112
-
113
-
114
-
115
-
116
-
117
-
118
-
119
-
120
-
121
-
122
-
123
-
124
-
125
-
126
-
127
-
128
-
129
-
130
-
131
-
132
-
133
-
134
-
135
-
 136
136 -
 137
137 -
 138
138 -
 139
139 -
 140
140 -
 141
141 -
 142
142 -
 143
143 -
 144
144 -
 145
145 -
 146
146 -
 147
147 -
 148
148 -
 149
149 -
 150
150 -
 151
151 -
 152
152 -
 153
153 -
 154
154 -
 155
155 -
 156
156 -
157
-
158
-
159
-
160
-
161
-
162
 |
 |
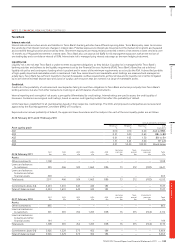
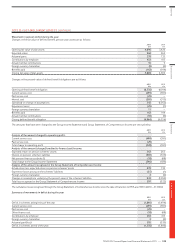
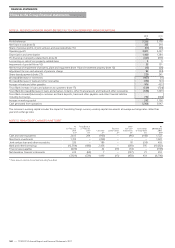
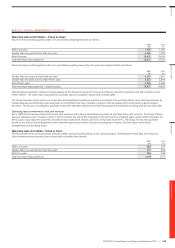
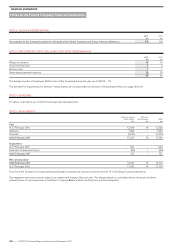
NOTE 31 RECONCILIATION OF PROFIT BEFORE TAX TO CASH GENERATED FROM OPERATIONS
2011
£m
2010
£m
Profit before tax 3,535 3,176
Net finance costs (note 5) 333 314
Share of post-tax profits of joint ventures and associates (note 13) (57) (33)
Operating profit 3,811 3,457
Depreciation and amortisation 1,420 1,384
Profit arising on property-related items (note 3) (427) (377)
Loss arising on sale of non property-related items 35
Impairment of goodwill (note 10) 55 131
Net reversal of impairment of property, plant and equipment (note 11) and investment property (note 12) (13) (26)
Adjustment for non-cash element of pensions charge 95 (24)
Share-based payments (note 27) 220 241
(Increase)/decrease in inventories (467) 34
(Increase)/decrease in trade and other receivables (152) 124
Increase in trade and other payables 976 453
Tesco Bank increase in loans and advances to customers (note 17) (529) (724)
Tesco Bank (increase)/decrease in loans and advances to banks, other financial assets and trade and other receivables (356) 1,369
Tesco Bank increase/(decrease) in customer and bank deposits, trade and other payables and other financial liabilities
including borrowings 730 (100)
Increase in working capital 202 1,156
Cash generated from operations 5,366 5,947
The increase in working capital includes the impact of translating foreign currency working capital movements at average exchange rates rather than
year end exchange rates.
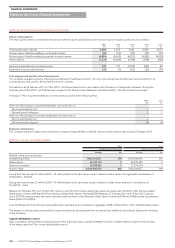
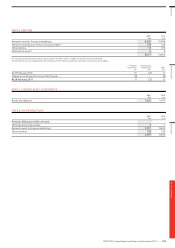
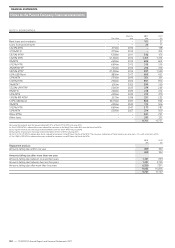
NOTE 32 ANALYSIS OF CHANGES IN NET DEBT
At
27 February
2010
£m*
Tesco Bank at
27 February
2010
£m
Cash flow
£m
Business
combinations
£m
Other
non-cash
movements
£m
Elimination
of Tesco Bank
£m
At
26 February
2011
£m*
Cash and cash equivalents 2,615 204 (903) – (46) (148) 1,722
Short-term investments 1,314 – (292) – – – 1,022
Joint venture loan and other receivables 320 – 189 – 18 (34) 493
Bank and other borrowings (12,584) (480) 2,456 – (269) 595 (10,282)
Finance lease payables (209) – 42 (17) (14) – (198)
Net derivative financial instruments 615 (63) 7 – (127) 21 453
(7,929) (339) 1,499 (17) (438) 434 (6,790)
* These amounts relate to the net debt excluding Tesco Bank.
FINANCIAL STATEMENTS
142
—
TESCO PLC Annual Report and Financial Statements 2011
Notes to the Group financial statements