Tesco 2011 Annual Report Download - page 86
Download and view the complete annual report
Please find page 86 of the 2011 Tesco annual report below. You can navigate through the pages in the report by either clicking on the pages listed below, or by using the keyword search tool below to find specific information within the annual report.
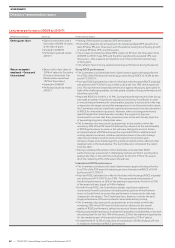
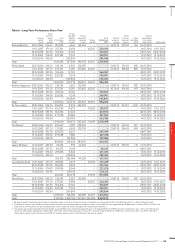
Long-term performance 2008/9 to 2010/11
Performance measures Award size Performance conditions
Earnings per share • Options over shares with a
face value of 200% of salary
at the date of grant
• Granted in 2008/09
• Performance period ended
2010/11
• Vesting of the awards is subject to EPS performance.
• First 100% subject to the achievement of underlying diluted EPS growth of at
least RPI plus 9% over three years with the balance vesting for achieving growth
of at least RPI plus 15% over three years.
• The increase in underlying diluted EPS relative to RPI over the three years from
2008/09 to 2010/11 was 32% and therefore significantly exceeded 15% over
three years – these options will therefore vest in full on the third anniversary
of their grant.
• This reflects Tesco’s strong sustained earnings performance during the period.
Return on capital
employed – Group and
International
• Shares with a face value of
150% of salary for Executive
Directors (other than Tim
Mason whose award was
100% of base salary)
• Granted in 2008/09
• Performance period ended
2010/11
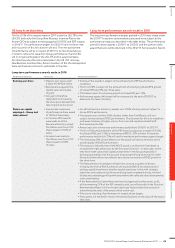
Group ROCE performance
• The Committee considered the level of performance against the target for the
first 75% of the PSP award of achieving post-tax Group ROCE of 14.2% by the
end of FY 2010/11.
• Post-tax ROCE (calculated on a like-for-like basis with the target ROCE originally
set) at the end of FY 2010/11 was 14.8% so all of the first 75% of the award will
vest. This represents exceptional performance against this target, particularly in
light of the challenging market, and the award related to Group performance will
therefore vest in full.
• Reported ROCE for 2010/11 is 12.9%. During the performance period the Group
has made a number of significant acquisitions (including Tesco Bank). In order
to ensure that performance for remuneration purposes is measured in a fair way
compared to the target set and that management is not disincentivised to invest,
the Committee excludes significant unplanned investments from the calculation
of ROCE for remuneration purposes. However, when assessing performance
against targets the Committee also considers the progress of any new
investments to ensure that these investments are in line with the key objective
of generating long-term shareholder value.
• The Committee also exercised its judgement as to the extent to which the
remaining 25% of the PSP award should vest by reference to the overall quality
of ROCE performance to ensure a fair outcome, taking into account factors
including the level of ROCE achieved, the expected ROCE for additional and
existing capital investment, whether capital spend was in line with strategic
objectives and balanced short-term and long-term investment needs,
the level of sales and underlying profit growth and whether this reflected other
developments in the marketplace. The Committee also considered the report
from the GOC.
• Having considered these factors the Committee concluded that ROCE
performance was exceptional in challenging markets and that it was therefore
appropriate that, in line with the vesting level for the first 75% of the award,
all of the remaining 25% of the award should vest.
International ROCE performance
• The Committee considered the level of performance against the target for the
first 75% of the PSP award of achieving post-tax International ROCE of 9.0%
by the end of FY 2010/11.
• Post-tax ROCE (calculated on a like-for-like basis with the target ROCE originally
set) at the end of FY 2010/11 was 7.0%. This represented achievement of
threshold performance so 25% of the maximum opportunity for the first 75%
of the award will vest (equal to 9.4% of salary).
• As with Group ROCE, the Committee excludes significant unplanned
investments from the calculation (including the acquisition of the Homever
stores in South Korea) to ensure that performance is measured in a fair way
compared to the targets. The Committee does, however, consider the early
stage performance of these investments when determining vesting.
• The Committee also exercised its judgement as to the extent to which the
remaining 25% of the PSP award should vest by reference to the overall
quality of ROCE performance, taking into account factors outlined above.
• Having considered these factors in detail the Committee concluded that, in line with
the vesting level for the first 75% of the award, 25% of the maximum opportunity
for the remaining part of the award should vest (equal to 3.1% of salary).
• In total therefore 12.5% of salary (out of a maximum of 50% of salary) will vest
in relation to International ROCE performance.
82
—
TESCO PLC Annual Report and Financial Statements 2011
GOVERNANCE
Directors’ remuneration report


