Tesco 2011 Annual Report Download - page 140
Download and view the complete annual report
Please find page 140 of the 2011 Tesco annual report below. You can navigate through the pages in the report by either clicking on the pages listed below, or by using the keyword search tool below to find specific information within the annual report.-
 1
1 -
2
-
3
-
4
-
5
-
6
-
7
-
8
-
9
-
10
-
11
-
12
-
13
-
14
-
15
-
16
-
17
-
18
-
19
-
20
-
21
-
22
-
23
-
24
-
25
-
26
-
27
-
28
-
29
-
30
-
31
-
32
-
33
-
34
-
35
-
36
-
37
-
38
-
39
-
40
-
41
-
42
-
43
-
44
-
45
-
46
-
47
-
48
-
49
-
50
-
51
-
52
-
53
-
54
-
55
-
56
-
57
-
58
-
59
-
60
-
61
-
62
-
63
-
64
-
65
-
66
-
67
-
68
-
69
-
70
-
71
-
72
-
73
-
74
-
75
-
76
-
77
-
78
-
79
-
80
-
81
-
82
-
83
-
84
-
85
-
86
-
87
-
88
-
89
-
90
-
91
-
92
-
93
-
94
-
95
-
96
-
97
-
98
-
99
-
100
-
101
-
102
-
103
-
104
-
105
-
106
-
107
-
108
-
109
-
110
-
111
-
112
-
113
-
114
-
115
-
116
-
117
-
118
-
119
-
120
-
121
-
122
-
123
-
124
-
125
-
126
-
127
-
128
-
129
-
 130
130 -
 131
131 -
 132
132 -
 133
133 -
 134
134 -
 135
135 -
 136
136 -
 137
137 -
 138
138 -
 139
139 -
 140
140 -
 141
141 -
 142
142 -
 143
143 -
 144
144 -
 145
145 -
 146
146 -
 147
147 -
 148
148 -
 149
149 -
 150
150 -
151
-
152
-
153
-
154
-
155
-
156
-
157
-
158
-
159
-
160
-
161
-
162
 |
 |

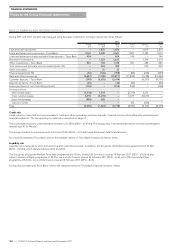
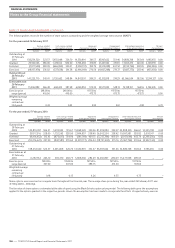
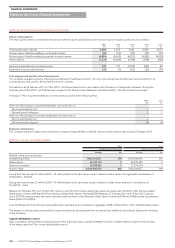
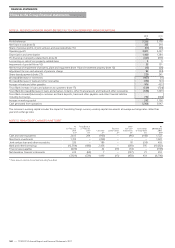
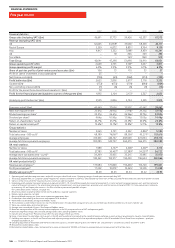
NOTE 27 SHARE-BASED PAYMENTS CONTINUED
The following tables reconcile the number of share options outstanding and the weighted average exercise price (WAEP):
For the year ended 26 February 2011
Savings-related
share option scheme
Irish savings-related
share option scheme
Approved
share option scheme
Unapproved
share option scheme
International executive
share option scheme
Nil cost
share options
Options WAEP Options WAEP Options WAEP Options WAEP Options WAEP Options WAEP
Outstanding at
27 February
2010 138,234,520 323.37 5,455,068 326.70 14,550,891 361.57 85,907,622 351.46 54,880,748 363.64 9,185,455 0.00
Granted 29,920,166 386.00 1,470,162 386.00 3,793,684 419.85 21,447,502 419.81 17,065,475 420.00 4,148,918 0.00
Forfeited (7,971,500) 328.09 (666,990) 320.21 (1,030,137) 395.79 (3,915,038) 401.52 (3,192,794) 382.05 (499,596) 0.00
Exercised (18,957,476) 256.02 (537,638) 261.38 (2,466,841) 270.56 (10,927,268) 274.37 (3,687,375) 283.46 (435,650) 0.00
Outstanding at
26 February
2011 141,225,710 345.41 5,720,602 348.84 14,847,597 389.21 92,512,818 374.29 65,066,054 382.06 12,399,127 0.00
Exercisable as at
26 February
2011 15,506,889 366.48 668,423 381.98 6,090,853 375.33 32,577,023 348.13 19,138,101 364.16 3,744,903 0.00
Exercise price
range (pence)
248.00 to
410.00
248.00 to
410.00
197.50 to
473.75
197.50 to
473.75
197.50 to
473.75 0.00
Weighted average
remaining
contractual
life (years) 0.43 0.43 4.92 4.61 4.98 6.74
For the year ended 27 February 2010
Savings-related
share option scheme
Irish savings-related
share option scheme
Approved
share option scheme
Unapproved
share option scheme
International executive
share option scheme
Nil cost
share options
Options WAEP Options WAEP Options WAEP Options WAEP Options WAEP Options WAEP
Outstanding at
28 February
2009 142,810,097 306.21 5,418,903 315.67 15,868,920 350.56 81,299,884 339.97 43,898,205 366.61 14,323,708 0.00
Granted 38,117,516 328.00 1,752,363 328.00 2,844,857 338.40 26,542,534 338.42 19,097,981 338.82 3,093,147 0.00
Forfeited (9,476,452) 315.43 (873,617) 314.96 (581,769) 409.75 (3,213,394) 409.29 (2,147,644) 403.74 (2,299,256) 0.00
Exercised (33,216,641) 257.20 (842,581) 270.60 (3,581,117) 286.54 (18,721,402) 273.16 (5,967,794) 291.66 (5,932,144) 0.00
Outstanding at
27 February
2010 138,234,520 323.37 5,455,068 326.70 14,550,891 361.57 85,907,622 351.46 54,880,748 363.64 9,185,455 0.00
Exercisable as at
27 February
2010 6,287,764 266.10 369,370 282.75 5,868,560 282.29 32,430,807 280.29 15,277,598 289.05 – –
Exercise price
range (pence)
195.00 to
307.00
195.00 to
307.00
197.50 to
388.75
197.50 to
415.50
197.50 to
318.60 –
Weighted average
remaining
contractual
life (years) 0.18 0.15 4.26 4.53 4.75 –
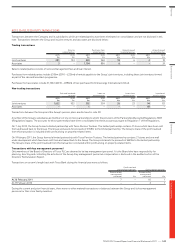
Share options were exercised on a regular basis throughout the financial year. The average share price during the year ended 26 February 2011 was
417.80p (2010 – 380.05p).
The fair value of share options is estimated at the date of grant using the Black-Scholes option pricing model. The following table gives the assumptions
applied to the options granted in the respective periods shown. No assumption has been made to incorporate the effects of expected early exercise.
FINANCIAL STATEMENTS
136
—
TESCO PLC Annual Report and Financial Statements 2011
Notes to the Group financial statements