Tesco 2011 Annual Report Download - page 156
Download and view the complete annual report
Please find page 156 of the 2011 Tesco annual report below. You can navigate through the pages in the report by either clicking on the pages listed below, or by using the keyword search tool below to find specific information within the annual report.-
 1
1 -
2
-
3
-
4
-
5
-
6
-
7
-
8
-
9
-
10
-
11
-
12
-
13
-
14
-
15
-
16
-
17
-
18
-
19
-
20
-
21
-
22
-
23
-
24
-
25
-
26
-
27
-
28
-
29
-
30
-
31
-
32
-
33
-
34
-
35
-
36
-
37
-
38
-
39
-
40
-
41
-
42
-
43
-
44
-
45
-
46
-
47
-
48
-
49
-
50
-
51
-
52
-
53
-
54
-
55
-
56
-
57
-
58
-
59
-
60
-
61
-
62
-
63
-
64
-
65
-
66
-
67
-
68
-
69
-
70
-
71
-
72
-
73
-
74
-
75
-
76
-
77
-
78
-
79
-
80
-
81
-
82
-
83
-
84
-
85
-
86
-
87
-
88
-
89
-
90
-
91
-
92
-
93
-
94
-
95
-
96
-
97
-
98
-
99
-
100
-
101
-
102
-
103
-
104
-
105
-
106
-
107
-
108
-
109
-
110
-
111
-
112
-
113
-
114
-
115
-
116
-
117
-
118
-
119
-
120
-
121
-
122
-
123
-
124
-
125
-
126
-
127
-
128
-
129
-
130
-
131
-
132
-
133
-
134
-
135
-
136
-
137
-
138
-
139
-
140
-
141
-
142
-
143
-
144
-
145
-
 146
146 -
 147
147 -
 148
148 -
 149
149 -
 150
150 -
 151
151 -
 152
152 -
 153
153 -
 154
154 -
 155
155 -
 156
156 -
 157
157 -
 158
158 -
 159
159 -
 160
160 -
 161
161 -
 162
162
 |
 |

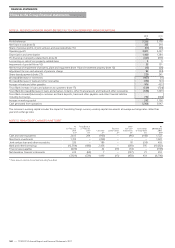
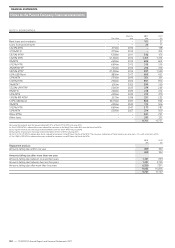
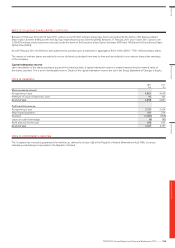
NOTE 9 BORROWINGS
Par value
Maturity
year
2011
£m
2010
£m
Bank loans and overdrafts – – 101 27
Loans from joint ventures – – 20 17
6.625% MTN £150m 2010 –158
4.75% MTN €750m 2010 –704
3.875% MTN(a) €389m 2011 346 479
5.625% MTN €1,500m 2012 1,317 1,375
5% MTN £600m 2014 606 604
5.125% MTN €600m 2015 510 539
4% RPI MTN(b) £263m 2016 276 270
5.875% MTN(c) €1,500m 2016 997 1,520
5.5% USD Bond $850m 2017 600 621
5.5% MTN £350m 2019 351 351
6.125% MTN £900m 2022 891 890
5% MTN(d) £515m 2023 390 520
3.322% LPI MTN(e) £265m 2025 279 269
6% MTN £200m 2029 218 212
5.5% MTN £200m 2033 215 210
1.982% RPI MTN(f) £221m 2036 231 222
6.15% USD Bond $1,150m 2037 804 834
5% MTN £300m 2042 174 306
5.125% MTN €600m 2047 577 587
5.2% MTN £500m 2057 274 500
Other MTNs – – 281 291
Other loans – – 243 231
9,701 11,737
(a) During the financial year the Group redeemed €111m of the 3.875% MTN maturing 2011.
(b) The 4% RPI MTN is redeemable at par, indexed for increases in the Retail Price Index (RPI) over the life of the MTN.
(c) During the financial year the Group redeemed €461m of the 5.875% MTN maturing 2016.
(d) During the financial year the Group redeemed £126m of the 5% MTN maturing 2023.
(e) The 3.322% LPI MTN is redeemable at par, indexed for increases in the RPI over the life of the MTN. The maximum indexation of the principal in any one year is 5%, with a minimum of 0%.
(f) The 1.982% RPI MTN is redeemable at par, indexed for increases in the RPI over the life of the MTN.
2011
£m
2010
£m
Repayment analysis:
Amounts falling due within one year 699 932
699 932
Amounts falling due after more than one year:
Amounts falling due between one and two years 1,321 699
Amounts falling due between two and five years 1,401 2,795
Amounts falling due after more than five years 6,280 7,311
9,002 10,805
9,701 11,737
FINANCIAL STATEMENTS
Notes to the Group financial statements
152
—
TESCO PLC Annual Report and Financial Statements 2011
Notes to the Parent Company financial statements