Tesco 2011 Annual Report Download - page 3
Download and view the complete annual report
Please find page 3 of the 2011 Tesco annual report below. You can navigate through the pages in the report by either clicking on the pages listed below, or by using the keyword search tool below to find specific information within the annual report.-
 1
1 -
 2
2 -
 3
3 -
 4
4 -
 5
5 -
 6
6 -
 7
7 -
 8
8 -
 9
9 -
 10
10 -
 11
11 -
 12
12 -
 13
13 -
 14
14 -
15
-
16
-
17
-
18
-
19
-
20
-
21
-
22
-
23
-
24
-
25
-
26
-
27
-
28
-
29
-
30
-
31
-
32
-
33
-
34
-
35
-
36
-
37
-
38
-
39
-
40
-
41
-
42
-
43
-
44
-
45
-
46
-
47
-
48
-
49
-
50
-
51
-
52
-
53
-
54
-
55
-
56
-
57
-
58
-
59
-
60
-
61
-
62
-
63
-
64
-
65
-
66
-
67
-
68
-
69
-
70
-
71
-
72
-
73
-
74
-
75
-
76
-
77
-
78
-
79
-
80
-
81
-
82
-
83
-
84
-
85
-
86
-
87
-
88
-
89
-
90
-
91
-
92
-
93
-
94
-
95
-
96
-
97
-
98
-
99
-
100
-
101
-
102
-
103
-
104
-
105
-
106
-
107
-
108
-
109
-
110
-
111
-
112
-
113
-
114
-
115
-
116
-
117
-
118
-
119
-
120
-
121
-
122
-
123
-
124
-
125
-
126
-
127
-
128
-
129
-
130
-
131
-
132
-
133
-
134
-
135
-
136
-
137
-
138
-
139
-
140
-
141
-
142
-
143
-
144
-
145
-
146
-
147
-
148
-
149
-
150
-
151
-
152
-
153
-
154
-
155
-
156
-
157
-
158
-
159
-
160
-
161
-
162
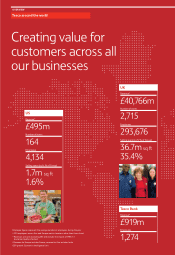
 |
 |

Revenue* GDP growth
(£m) Stores Employees (% real change pa)
South Korea 4,984 354 23,131 6.1
Thailand 2,844 782 38,395 7.9
China 1,141 105 27,096 10.3
Malaysia 794 38 11,023 7.2
Japan 476 140 4,367 4.0
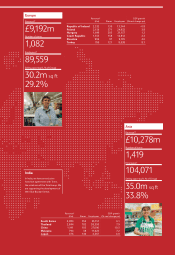
Europe
Revenue*†
£9,192m
Number of stores
1,082
Employees±
89,559
Selling space (sq ft, % of Group)
30.2m sq ft
29.2%
India
In India, we have an exclusive
franchise agreement with Trent,
the retail arm of the Tata Group. We
are supporting the development of
their Star Bazaar format.
Asia
Revenue*†
£10,278m
Number of stores
1,419
Employees±
104,071
Selling space (sq ft, % of Group)
35.0m sq ft
33.8%
Revenue* GDP growth
(£m) Stores Employees (% real change pa)
Republic of Ireland 2,332 130 13,344 -0.8
Poland 2,156 371 24,932 3.8
Hungary 1,649 205 21,157 1.2
Czech Republic 1,355 158 12,812 2.3
Slovakia 996 97 9,105 4.0
Turkey 700 121 8,038 8.1
C O N R A N D E S I G N G R O U P