Tesco 2011 Annual Report Download - page 141
Download and view the complete annual report
Please find page 141 of the 2011 Tesco annual report below. You can navigate through the pages in the report by either clicking on the pages listed below, or by using the keyword search tool below to find specific information within the annual report.-
 1
1 -
2
-
3
-
4
-
5
-
6
-
7
-
8
-
9
-
10
-
11
-
12
-
13
-
14
-
15
-
16
-
17
-
18
-
19
-
20
-
21
-
22
-
23
-
24
-
25
-
26
-
27
-
28
-
29
-
30
-
31
-
32
-
33
-
34
-
35
-
36
-
37
-
38
-
39
-
40
-
41
-
42
-
43
-
44
-
45
-
46
-
47
-
48
-
49
-
50
-
51
-
52
-
53
-
54
-
55
-
56
-
57
-
58
-
59
-
60
-
61
-
62
-
63
-
64
-
65
-
66
-
67
-
68
-
69
-
70
-
71
-
72
-
73
-
74
-
75
-
76
-
77
-
78
-
79
-
80
-
81
-
82
-
83
-
84
-
85
-
86
-
87
-
88
-
89
-
90
-
91
-
92
-
93
-
94
-
95
-
96
-
97
-
98
-
99
-
100
-
101
-
102
-
103
-
104
-
105
-
106
-
107
-
108
-
109
-
110
-
111
-
112
-
113
-
114
-
115
-
116
-
117
-
118
-
119
-
120
-
121
-
122
-
123
-
124
-
125
-
126
-
127
-
128
-
129
-
130
-
 131
131 -
 132
132 -
 133
133 -
 134
134 -
 135
135 -
 136
136 -
 137
137 -
 138
138 -
 139
139 -
 140
140 -
 141
141 -
 142
142 -
 143
143 -
 144
144 -
 145
145 -
 146
146 -
 147
147 -
 148
148 -
 149
149 -
 150
150 -
 151
151 -
152
-
153
-
154
-
155
-
156
-
157
-
158
-
159
-
160
-
161
-
162
 |
 |

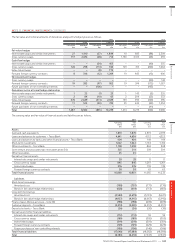
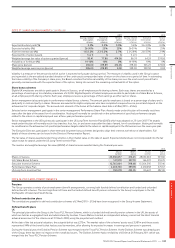
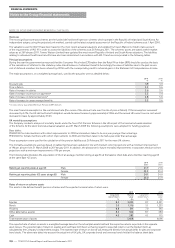
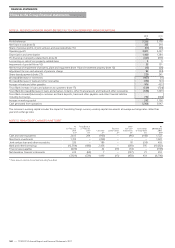
NOTE 27 SHARE-BASED PAYMENTS CONTINUED
2011 2010
Savings-related
share option
schemes
Executive
share option
schemes
Nil cost
option
schemes
Savings-related
share option
schemes
Executive
share option
schemes
Nil cost
option
schemes
Expected dividend yield (%) 3.5% 3.5% 0.0% 3.6% 3.6-3.9% 0.0%
Expected volatility (%) 26-30% 25% 25% 26-31% 25% 25%
Risk-free interest rate (%) 1.6-2.2% 2.3-3.2% 2.7% 2.0-2.8% 2.8-3.3% 2.9%
Expected life of option (years) 3 or 5 6 6 3 or 5 6 6
Weighted average fair value of options granted (pence) 93.41 77.86 414.06 86.74 64.24 374.00
Probability of forfeiture (%) 14-16% 10% 0% 14-16% 10% 0%
Share price (pence) 436.00 419.89 414.06 378.00 345.23 374.00
Weighted average exercise price (pence) 386.00 419.89 0.00 328.00 338.58 0.00
Volatility is a measure of the amount by which a price is expected to fluctuate during a period. The measure of volatility used in the Group’s option
pricing models is the annualised standard deviation of the continuously compounded rates of return on the share over a period of time. In estimating
the future volatility of the Company’s share price, the Board considers the historical volatility of the share price over the most recent period that is
generally commensurate with the expected term of the option, taking into account the remaining contractual life of the option.
Share bonus schemes
Eligible UK employees are able to participate in Shares in Success, an all-employee profit-sharing scheme. Each year, shares are awarded as a
percentage of earnings up to a statutory maximum of £3,000. Eligible Republic of Ireland employees are able to participate in a Share Bonus Scheme,
an all-employee profit-sharing scheme. Each year, employees receive a percentage of their earnings as either cash or shares.
Senior management also participate in performance-related bonus schemes. The amount paid to employees is based on a percentage of salary and is
paid partly in cash and partly in shares. Bonuses are awarded to eligible employees who have completed a required service period and depend on the
achievement of corporate targets. The accrued cash element of the bonus at the balance sheet date is £38m (2010 – £52m).
Selected senior management participate in the senior management Performance Share Plan. Awards made under this plan will normally vest three
years after the date of the award for nil consideration. Vesting will normally be conditional on the achievement of specified performance targets
related to the return on capital employed over a three-year performance period.
Senior management in the US business also participate in the US Long-Term Incentive Plan (2007) which was adopted on 29 June 2007. The awards
made under this plan will normally vest in four tranches: four, five, six and seven years after the date of award, for nil consideration. Vesting will normally
be conditional on the achievement of specified performance targets related to the return on capital employed in the US business over the seven-year plan.
The Executive Directors participate in short-term and long-term bonus schemes designed to align their interests with those of shareholders. Full
details of these schemes can be found in the Directors’ Remuneration Report.
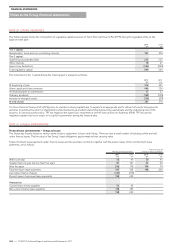
The fair value of shares awarded under these schemes is their market value on the date of award. Expected dividends are not incorporated into the fair
value except for awards under the US Long-Term Incentive Plan.
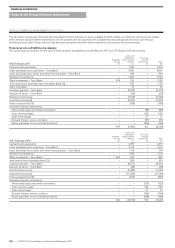
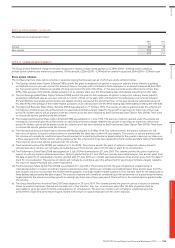
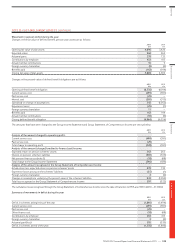
The number and weighted average fair value (WAFV) of share bonuses awarded during the financial year were:
2011 2010
Shares
number
WAFV
pence
Shares
number
WAFV
pence
Shares in Success 25,360,677 416.23 28,661,004 349.66
Irish Share Bonus Scheme 141,970 397.70 166,972 359.70
Executive Incentive Scheme 12,765,004 398.68 13,564,595 355.46
Performance Share Plan 2,405,730 399.78 2,120,058 375.37
US Long-Term Incentive Plan 192,078 433.05 80,622 482.00
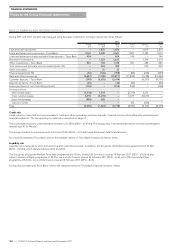
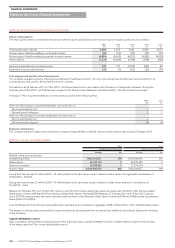
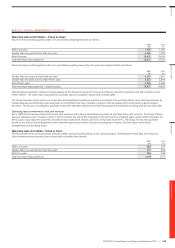
NOTE 28 POST-EMPLOYMENT BENEFITS
Pensions
The Group operates a variety of post-employment benefit arrangements, covering both funded defined contribution and funded and unfunded
defined benefit schemes. The most significant of these are the funded defined benefit pension schemes for the Group’s employees in the UK,
the Republic of Ireland and South Korea.
Defined contribution plans
The contributions payable for defined contribution schemes of £14m (2010 – £12m) have been recognised in the Group Income Statement.
Defined benefit plans
UK
The principal plan within the Group is the Tesco PLC Pension Scheme, which is a funded defined benefit pension scheme in the UK, the assets of
which are held as a segregated fund and administered by trustees. Towers Watson Limited, an independent actuary, carried out the latest triennial
actuarial assessment of the scheme as at 31 March 2008, using the projected unit method.
At the date of the last actuarial valuation, the actuarial deficit was £275m. The market value of the schemes’ assets was £3,987m and these assets
represented 94% of the benefits that had accrued to members, after allowing for expected increases in earnings and pensions in payment.
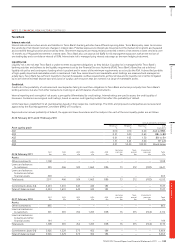
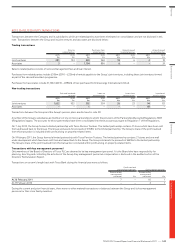
During the financial year, the Dobbies Pension Scheme was merged into the Tesco PLC Pension Scheme. As the Dobbies Scheme was already part
of the Group, there has been no impact on the overall disclosures. The Dobbies Scheme had a net liability of £0.6m at 26 February 2011 which was
merged into the Tesco PLC Pension Scheme.
Overview Business review Governance Financial statements
TESCO PLC Annual Report and Financial Statements 2011
—
137