Tesco 2011 Annual Report Download - page 158
Download and view the complete annual report
Please find page 158 of the 2011 Tesco annual report below. You can navigate through the pages in the report by either clicking on the pages listed below, or by using the keyword search tool below to find specific information within the annual report.-
 1
1 -
2
-
3
-
4
-
5
-
6
-
7
-
8
-
9
-
10
-
11
-
12
-
13
-
14
-
15
-
16
-
17
-
18
-
19
-
20
-
21
-
22
-
23
-
24
-
25
-
26
-
27
-
28
-
29
-
30
-
31
-
32
-
33
-
34
-
35
-
36
-
37
-
38
-
39
-
40
-
41
-
42
-
43
-
44
-
45
-
46
-
47
-
48
-
49
-
50
-
51
-
52
-
53
-
54
-
55
-
56
-
57
-
58
-
59
-
60
-
61
-
62
-
63
-
64
-
65
-
66
-
67
-
68
-
69
-
70
-
71
-
72
-
73
-
74
-
75
-
76
-
77
-
78
-
79
-
80
-
81
-
82
-
83
-
84
-
85
-
86
-
87
-
88
-
89
-
90
-
91
-
92
-
93
-
94
-
95
-
96
-
97
-
98
-
99
-
100
-
101
-
102
-
103
-
104
-
105
-
106
-
107
-
108
-
109
-
110
-
111
-
112
-
113
-
114
-
115
-
116
-
117
-
118
-
119
-
120
-
121
-
122
-
123
-
124
-
125
-
126
-
127
-
128
-
129
-
130
-
131
-
132
-
133
-
134
-
135
-
136
-
137
-
138
-
139
-
140
-
141
-
142
-
143
-
144
-
145
-
146
-
147
-
 148
148 -
 149
149 -
 150
150 -
 151
151 -
 152
152 -
 153
153 -
 154
154 -
 155
155 -
 156
156 -
 157
157 -
 158
158 -
 159
159 -
 160
160 -
 161
161 -
 162
162
 |
 |

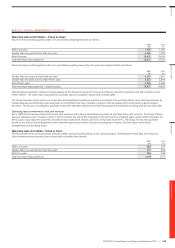
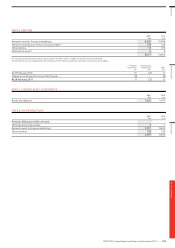
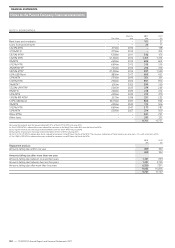
NOTE 11 SHARE-BASED PAYMENTS CONTINUED
For the year ended 27 February 2010
Savings-related
share option scheme
Approved
share option scheme
Unapproved
share option scheme
Nil cost
share options
Options WAEP Options WAEP Options WAEP Options WAEP
Outstanding at
28 February 2009 37,066 294.06 53,381 280.99 14,681,115 326.92 14,430,093 0.00
Granted 7,584 328.00 – – 3,804,440 338.40 3,093,147 0.00
Forfeited – – – – – – (2,299,256) 0.00
Exercised (8,544) 232.00 – – (3,936,026) 261.41 (6,038,529) 0.00
Outstanding at
27 February 2010 36,106 315.87 53,381 280.99 14,549,529 347.65 9,185,455 0.00
Exercisable as at
27 February 2010 – – 53,381 280.99 6,240,433 281.85 – –
Exercise price range
(pence) –
197.50 to
318.60
197.50 to
318.60 –
Weighted average remaining
contractual life (years) – 4.77 4.40 –
Share bonus schemes
The number and weighted average fair value (WAFV) of share bonuses awarded during the financial year relating to Tesco PLC employees are:
2011 2010
Shares
number
WAFV
pence
Shares
number
WAFV
pence
Shares in Success 5,766 416.23 6,684 349.66
Executive Incentive Scheme 292,085 388.05 1,660,771 351.16
Performance Share Plan 218,620 433.79 243,129 374.00
US Long-Term Incentive Plan 74,997 433.06 80,622 482.00
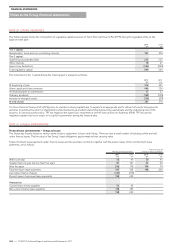
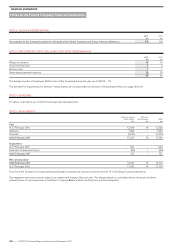
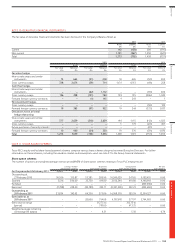
NOTE 12 PENSIONS
The total cost of the pension scheme to the Group was £546m (2010 – £439m). Further disclosure relating to the Tesco PLC Pension Scheme can be
found in note 28 of the Group financial statements.
NOTE 13 CALLED UP SHARE CAPITAL
2011 2010
Ordinary shares of 5p each Ordinary shares of 5p each
Number £m Number £m
Allotted, called up and fully paid:
At beginning of year 7,985,044,057 399 7,895,344,018 395
Share options 36,535,102 2 62,329,535 3
Share bonus awards 24,888,933 1 27,370,504 1
At end of year 8,046,468,092 402 7,985,044,057 399
During the financial year, 37 million (2010 – 62 million) shares of 5p each were issued in relation to share options for aggregate consideration of £97m
(2010 – £166m).
During the financial year, 25 million (2010 – 27 million) shares of 5p each were issued in relation to share bonus awards for consideration of £1m
(2010 – £1m).
FINANCIAL STATEMENTS
154
—
TESCO PLC Annual Report and Financial Statements 2011
Notes to the Parent Company financial statements