Tesco 2011 Annual Report Download - page 133
Download and view the complete annual report
Please find page 133 of the 2011 Tesco annual report below. You can navigate through the pages in the report by either clicking on the pages listed below, or by using the keyword search tool below to find specific information within the annual report.-
 1
1 -
2
-
3
-
4
-
5
-
6
-
7
-
8
-
9
-
10
-
11
-
12
-
13
-
14
-
15
-
16
-
17
-
18
-
19
-
20
-
21
-
22
-
23
-
24
-
25
-
26
-
27
-
28
-
29
-
30
-
31
-
32
-
33
-
34
-
35
-
36
-
37
-
38
-
39
-
40
-
41
-
42
-
43
-
44
-
45
-
46
-
47
-
48
-
49
-
50
-
51
-
52
-
53
-
54
-
55
-
56
-
57
-
58
-
59
-
60
-
61
-
62
-
63
-
64
-
65
-
66
-
67
-
68
-
69
-
70
-
71
-
72
-
73
-
74
-
75
-
76
-
77
-
78
-
79
-
80
-
81
-
82
-
83
-
84
-
85
-
86
-
87
-
88
-
89
-
90
-
91
-
92
-
93
-
94
-
95
-
96
-
97
-
98
-
99
-
100
-
101
-
102
-
103
-
104
-
105
-
106
-
107
-
108
-
109
-
110
-
111
-
112
-
113
-
114
-
115
-
116
-
117
-
118
-
119
-
120
-
121
-
122
-
 123
123 -
 124
124 -
 125
125 -
 126
126 -
 127
127 -
 128
128 -
 129
129 -
 130
130 -
 131
131 -
 132
132 -
 133
133 -
 134
134 -
 135
135 -
 136
136 -
 137
137 -
 138
138 -
 139
139 -
 140
140 -
 141
141 -
 142
142 -
 143
143 -
144
-
145
-
146
-
147
-
148
-
149
-
150
-
151
-
152
-
153
-
154
-
155
-
156
-
157
-
158
-
159
-
160
-
161
-
162
 |
 |

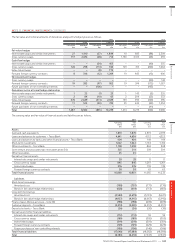
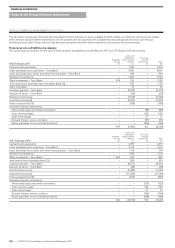
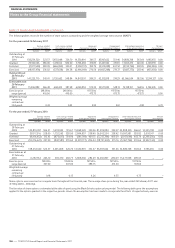
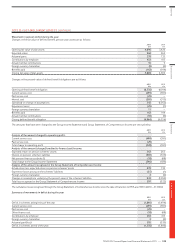
NOTE 22 FINANCIAL INSTRUMENTS CONTINUED
The following table presents the Group’s financial assets and liabilities that are measured at fair value at 26 February 2011, by level of fair value hierarchy:
• quoted prices (unadjusted) in active markets for identical assets or liabilities (Level 1);
• inputs other than quoted prices included within Level 1 that are observable for the asset or liability, either directly (that is, as prices) or indirectly
(that is, derived from prices) (Level 2); and
• inputs for the asset or liability that are not based on observable market data (that is, unobservable inputs) (Level 3).
Level 1
£m
Level 2
£m
Level 3
£m
Total
£m
Assets
Available-for-sale financial assets 188 661 – 849
Derivative financial instruments:
Interest rate swaps and similar instruments – 28 – 28
Cross currency swaps – 845 – 845
Index-linked swaps – 376 – 376
Forward foreign currency contracts – 38 – 38
Total assets 188 1,948 – 2,136
Liabilities
Derivative financial instruments:
Interest rate swaps and similar instruments – (112) – (112)
Cross currency swaps – (189) – (189)
Index-linked swaps – (319) – (319)
Forward foreign currency contracts – (129) – (129)
Future purchases of non-controlling interests – – (106) (106)
Total liabilities – (749) (106) (855)
Total 188 1,200 (106) 1,282
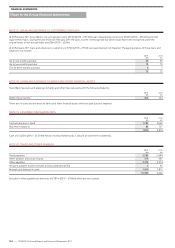
The following table presents the changes in Level 3 instruments:
2011
£m
2010
£m
At beginning of year (146) (200)
Losses recognised in finance costs in the Group Income Statement (6) (26)
Gains/(losses) recognised in the Group Statement of Changes in Equity 2(11)
Cash flow 44 91
At end of year (106) (146)
During the financial year there were no transfers between Level 1 and Level 2 fair value measurements, and no transfers into or out of Level 3 fair
value measurements. A reasonably possible change in assumptions is unlikely to result in a significant change in the fair value of Level 3 instruments.
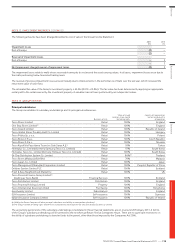
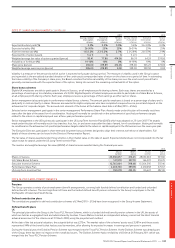
NOTE 23 FINANCIAL RISK FACTORS
The main financial risks faced by the Group relate to fluctuations in interest and foreign exchange rates, the risk of default by counterparties to
financial transactions and the availability of funds to meet business needs. The management of these risks is set out below. The Group Balance Sheet
position at 26 February 2011 is representative of the position throughout the financial year.
Risk management is carried out by a central treasury department under policies approved by the Board of Directors. The Board provides written
principles for risk management, as described in the Business Review on pages 51 to 57.
Interest rate risk
Interest rate risk arises from long-term borrowings. Debt issued at variable rates exposes the Group to cash flow interest rate risk. Debt issued at fixed
rates exposes the Group to fair value risk. Our interest rate management policy is explained on page 56.
The Group has Retail Price Index (RPI) debt where the principal is indexed to increases in the RPI index. RPI debt is treated as floating rate debt.
The Group also has Limited Price lnflation (LPI) debt, where the principal is indexed to RPI, with an annual maximum increase of 5% and a minimum
of 0%. LPI debt is treated as fixed rate debt.
For interest rate risk relating to Tesco Bank, refer to the separate section on Tesco Bank financial risk factors below.
Overview Business review Governance Financial statements
TESCO PLC Annual Report and Financial Statements 2011
—
129