Tesco 2011 Annual Report Download - page 85
Download and view the complete annual report
Please find page 85 of the 2011 Tesco annual report below. You can navigate through the pages in the report by either clicking on the pages listed below, or by using the keyword search tool below to find specific information within the annual report.-
 1
1 -
2
-
3
-
4
-
5
-
6
-
7
-
8
-
9
-
10
-
11
-
12
-
13
-
14
-
15
-
16
-
17
-
18
-
19
-
20
-
21
-
22
-
23
-
24
-
25
-
26
-
27
-
28
-
29
-
30
-
31
-
32
-
33
-
34
-
35
-
36
-
37
-
38
-
39
-
40
-
41
-
42
-
43
-
44
-
45
-
46
-
47
-
48
-
49
-
50
-
51
-
52
-
53
-
54
-
55
-
56
-
57
-
58
-
59
-
60
-
61
-
62
-
63
-
64
-
65
-
66
-
67
-
68
-
69
-
70
-
71
-
72
-
73
-
74
-
 75
75 -
 76
76 -
 77
77 -
 78
78 -
 79
79 -
 80
80 -
 81
81 -
 82
82 -
 83
83 -
 84
84 -
 85
85 -
 86
86 -
 87
87 -
 88
88 -
 89
89 -
 90
90 -
 91
91 -
 92
92 -
 93
93 -
 94
94 -
 95
95 -
96
-
97
-
98
-
99
-
100
-
101
-
102
-
103
-
104
-
105
-
106
-
107
-
108
-
109
-
110
-
111
-
112
-
113
-
114
-
115
-
116
-
117
-
118
-
119
-
120
-
121
-
122
-
123
-
124
-
125
-
126
-
127
-
128
-
129
-
130
-
131
-
132
-
133
-
134
-
135
-
136
-
137
-
138
-
139
-
140
-
141
-
142
-
143
-
144
-
145
-
146
-
147
-
148
-
149
-
150
-
151
-
152
-
153
-
154
-
155
-
156
-
157
-
158
-
159
-
160
-
161
-
162
 |
 |

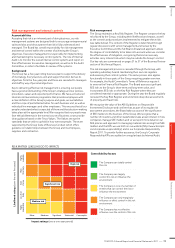
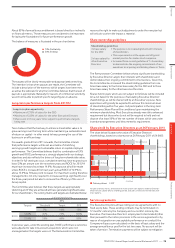
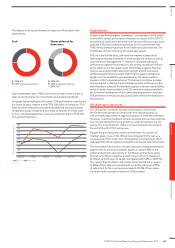
The balance of Group performance measures is illustrated in the
charts below:
Cash Shares deferred for
three years
25% Corporate objectives
75% EPS
Tesco Bank
50% EPS
30% Corporate objectives
20% TSR
Total shareholder return (TSR) is the notional return from a share or
index based on share price movements and declared dividends.
The graph below highlights the Group’s TSR performance over the last
five financial years, relative to the FTSE 100 index of companies. This
index has been selected to provide an established and broad-based
comparator group of retail and non-retail companies of similar scale
to Tesco. As illustrated below, Tesco has outperformed the FTSE 100
throughout the period.
Value of £100 invested 1 March 06
Feb 08Feb 07 Feb 09 Feb 10 Feb 11Feb 06
140
150
130
110
100
120
90
80
70
FTSE 100 Tesco
Payout levels
Following the Remuneration Committee’s consideration of the extent
to which the various performance measures in respect of the 2010/11
annual bonus award were achieved, the Executive Directors have been
awarded 92% of the potential maximum for the cash element and
76% of the potential maximum for the deferred shares element. The
Committee considers this level of reward appropriate.
EPS, on a like-for-like basis, achieved the maximum award level,
reflecting strong improvements in underlying profit growth as well as
sound financial management. In respect of corporate objectives,
performance against most measures was strong, resulting in delivery
at the upper end of the target range. Performance against financial
metrics was excellent with retail profit growth and UK new space
addition targets being exceeded. Performance against operational
targets, such as availability, was weakened by the severe weather
situation in Q4, but remained good. The business continues to make
strong progress in developing and deploying talent and targets in this
area have been achieved. Performance against corporate responsibility
metrics has also been excellent, with CO2 emissions reduced and with
the continued development of our community programmes. Long-term
TSR performance remains strong, but has been behind the market over
the past year.
US short-term objectives
The US business continues to make solid progress, with strong
like-for-like sales growth and improved store operating ratios, as
well as steady improvements against a number of other key milestone
measures. Customer feedback remains excellent and our clear objective
now is to accelerate the strong growth in customer numbers we are
seeing. The overall business remains on track to break even towards
the end of the 2012/13 financial year.
Despite the good progress and the achievement of a number of
strategic goals, losses in the US business increased in the year, as a
consequence of the initial costs of integrating our acquisitions of two
dedicated fresh food suppliers and adverse exchange rate movements.
The Committee has therefore decided, having reviewed performance
against both financial and strategic targets, to award 40% of the
potential maximum opportunity to Tim Mason and Sir Terry Leahy
for that part of their respective annual bonuses which is measured
by reference to US-specific targets (compared with 65% in 2009/10).
This means that Tim Mason will receive an annual US bonus award
of 80% of base salary (compared with a possible maximum 200%
of salary) and Sir Terry will receive an award of 20% of base salary
(compared with a possible maximum 50% of salary).
TESCO PLC Annual Report and Financial Statements 2011
—
81
Overview Business review Governance Financial statements