Tesco 2011 Annual Report Download - page 143
Download and view the complete annual report
Please find page 143 of the 2011 Tesco annual report below. You can navigate through the pages in the report by either clicking on the pages listed below, or by using the keyword search tool below to find specific information within the annual report.-
 1
1 -
2
-
3
-
4
-
5
-
6
-
7
-
8
-
9
-
10
-
11
-
12
-
13
-
14
-
15
-
16
-
17
-
18
-
19
-
20
-
21
-
22
-
23
-
24
-
25
-
26
-
27
-
28
-
29
-
30
-
31
-
32
-
33
-
34
-
35
-
36
-
37
-
38
-
39
-
40
-
41
-
42
-
43
-
44
-
45
-
46
-
47
-
48
-
49
-
50
-
51
-
52
-
53
-
54
-
55
-
56
-
57
-
58
-
59
-
60
-
61
-
62
-
63
-
64
-
65
-
66
-
67
-
68
-
69
-
70
-
71
-
72
-
73
-
74
-
75
-
76
-
77
-
78
-
79
-
80
-
81
-
82
-
83
-
84
-
85
-
86
-
87
-
88
-
89
-
90
-
91
-
92
-
93
-
94
-
95
-
96
-
97
-
98
-
99
-
100
-
101
-
102
-
103
-
104
-
105
-
106
-
107
-
108
-
109
-
110
-
111
-
112
-
113
-
114
-
115
-
116
-
117
-
118
-
119
-
120
-
121
-
122
-
123
-
124
-
125
-
126
-
127
-
128
-
129
-
130
-
131
-
132
-
 133
133 -
 134
134 -
 135
135 -
 136
136 -
 137
137 -
 138
138 -
 139
139 -
 140
140 -
 141
141 -
 142
142 -
 143
143 -
 144
144 -
 145
145 -
 146
146 -
 147
147 -
 148
148 -
 149
149 -
 150
150 -
 151
151 -
 152
152 -
 153
153 -
154
-
155
-
156
-
157
-
158
-
159
-
160
-
161
-
162
 |
 |

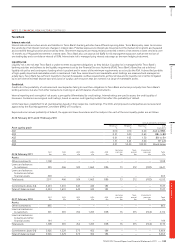
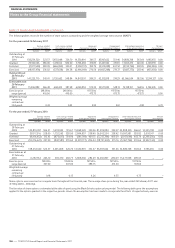
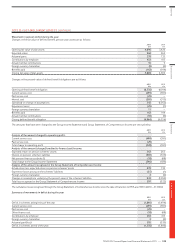
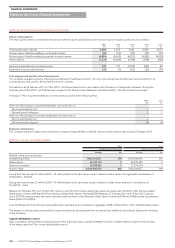
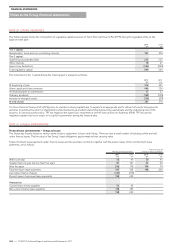
NOTE 28 POST-EMPLOYMENT BENEFITS CONTINUED
Movement in pension deficit during the year
Changes in the fair value of defined benefit pension plan assets are as follows:
2011
£m
2010
£m
Opening fair value of plan assets 4,696 3,420
Expected return 363 265
Actuarial gains 278 733
Contributions by employer 433 415
Actual member contributions 10 9
Foreign currency translation (9) (2)
Benefits paid (163) (144)
Closing fair value of plan assets 5,608 4,696
Changes in the present value of defined benefit obligations are as follows:
2011
£m
2010
£m
Opening defined benefit obligation (6,536) (4,914)
Current service cost (499) (391)
Past service cost (29) –
Interest cost (381) (313)
Gain/(loss) on change of assumptions 342 (1,052)
Experience losses (25) (1)
Foreign currency translation 11 –
Benefits paid 163 144
Actual member contributions (10) (9)
Closing defined benefit obligation (6,964) (6,536)
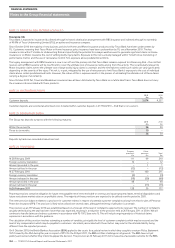
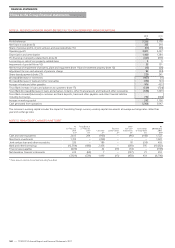
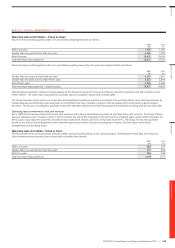
The amounts that have been charged to the Group Income Statement and Group Statement of Comprehensive Income are set out below:
2011
£m
2010
£m
Analysis of the amount charged to operating profit:
Current service cost (499) (391)
Past service cost (29) –
Total charge to operating profit (528) (391)
Analysis of the amount (charged)/credited to finance (cost)/income:
Expected return on pension schemes’ assets 363 265
Interest on pension schemes’ liabilities (381) (313)
Net pension finance cost (note 5) (18) (48)
Total charge to the Group Income Statement (546) (439)
Analysis of the amount recognised in the Group Statement of Comprehensive Income:
Actual return less expected return on pension schemes’ assets 278 733
Experience losses arising on the schemes’ liabilities (25) (1)
Foreign currency translation 2 (2)
Changes in assumptions underlying the present value of the schemes’ liabilities 342 (1,052)
Total loss recognised in the Group Statement of Comprehensive Income 597 (322)
The cumulative losses recognised through the Group Statement of Comprehensive Income since the date of transition to IFRS are £539m (2010 –£1,136m).
Summary of movements in deficit during the year
2011
£m
2010
£m
Deficit in schemes at beginning of the year (1,840) (1,494)
Current service cost (499) (391)
Past service cost (29) –
Other finance cost (18) (48)
Contributions by employer 433 415
Foreign currency translation 2 (2)
Actuarial gain/(loss) 595 (320)
Deficit in schemes at end of the year (1,356) (1,840)
Overview Business review Governance Financial statements
TESCO PLC Annual Report and Financial Statements 2011
—
139