Tesco 2011 Annual Report Download - page 121
Download and view the complete annual report
Please find page 121 of the 2011 Tesco annual report below. You can navigate through the pages in the report by either clicking on the pages listed below, or by using the keyword search tool below to find specific information within the annual report.-
 1
1 -
2
-
3
-
4
-
5
-
6
-
7
-
8
-
9
-
10
-
11
-
12
-
13
-
14
-
15
-
16
-
17
-
18
-
19
-
20
-
21
-
22
-
23
-
24
-
25
-
26
-
27
-
28
-
29
-
30
-
31
-
32
-
33
-
34
-
35
-
36
-
37
-
38
-
39
-
40
-
41
-
42
-
43
-
44
-
45
-
46
-
47
-
48
-
49
-
50
-
51
-
52
-
53
-
54
-
55
-
56
-
57
-
58
-
59
-
60
-
61
-
62
-
63
-
64
-
65
-
66
-
67
-
68
-
69
-
70
-
71
-
72
-
73
-
74
-
75
-
76
-
77
-
78
-
79
-
80
-
81
-
82
-
83
-
84
-
85
-
86
-
87
-
88
-
89
-
90
-
91
-
92
-
93
-
94
-
95
-
96
-
97
-
98
-
99
-
100
-
101
-
102
-
103
-
104
-
105
-
106
-
107
-
108
-
109
-
110
-
 111
111 -
 112
112 -
 113
113 -
 114
114 -
 115
115 -
 116
116 -
 117
117 -
 118
118 -
 119
119 -
 120
120 -
 121
121 -
 122
122 -
 123
123 -
 124
124 -
 125
125 -
 126
126 -
 127
127 -
 128
128 -
 129
129 -
 130
130 -
 131
131 -
132
-
133
-
134
-
135
-
136
-
137
-
138
-
139
-
140
-
141
-
142
-
143
-
144
-
145
-
146
-
147
-
148
-
149
-
150
-
151
-
152
-
153
-
154
-
155
-
156
-
157
-
158
-
159
-
160
-
161
-
162
 |
 |

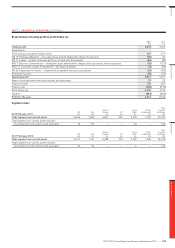
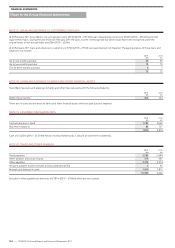
NOTE 11 PROPERTY, PLANT AND EQUIPMENT CONTINUED
Land and
buildings
£m
Other(a)
£m
Total
£m
Cost
At 28 February 2009 22,349 7,495 29,844
Foreign currency translation 793 234 1,027
Additions(b) 2,189 735 2,924
Reclassification (279) 71 (208)
Classified as held for sale 2 4 6
Disposals (1,669) (141) (1,810)
At 27 February 2010 23,385 8,398 31,783
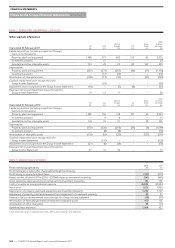
Accumulated depreciation and impairment losses
At 28 February 2009 2,540 4,152 6,692
Foreign currency translation 80 121 201
Charge for the year 354 737 1,091
Impairment losses for the year 51 – 51
Reversal of impairment losses for the year (74) – (74)
Reclassification (34) (48) (82)
Classified as held for sale (39) 1 (38)
Disposals (178) (83) (261)
At 27 February 2010 2,700 4,880 7,580
Net carrying value(c)(d)(e)
At 27 February 2010 20,685 3,518 24,203
At 28 February 2009 19,809 3,343 23,152
Construction in progress included above(f )
At 27 February 2010 1,652 193 1,845
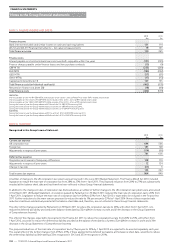
Impairment of property, plant and equipment
The Group has determined that for the purposes of impairment testing, each store is a cash-generating unit. Cash-generating units are tested for
impairment if there are indications of impairment at the balance sheet date.
Recoverable amounts for cash-generating units are mainly based on value in use, which is generally calculated from cash flow projections for five to
20 years using data from the Group’s latest internal forecasts, the results of which are reviewed by the Board. The key assumptions for the value in use
calculations are those regarding discount rates, growth rates and expected changes in margins. Management estimate discount rates using pre-tax rates
that reflect the current market assessment of the time value of money and the risks specific to the cash-generating units. Changes in selling prices and
direct costs are based on past experience and expectations of future changes in the market.
The forecasts are extrapolated beyond five years based on estimated long-term growth rates of 2% to 5% (2010 – 1% to 4%).
The pre-tax discount rates used to calculate value in use range from 6% to 14% (2010 – 6% to 14%) depending on the specific conditions in which
each store operates. These discount rates are derived from the Group’s post-tax weighted average cost of capital.
Overview Business review Governance Financial statements
TESCO PLC Annual Report and Financial Statements 2011
—
117