Tesco 2011 Annual Report Download - page 54
Download and view the complete annual report
Please find page 54 of the 2011 Tesco annual report below. You can navigate through the pages in the report by either clicking on the pages listed below, or by using the keyword search tool below to find specific information within the annual report.-
 1
1 -
2
-
3
-
4
-
5
-
6
-
7
-
8
-
9
-
10
-
11
-
12
-
13
-
14
-
15
-
16
-
17
-
18
-
19
-
20
-
21
-
22
-
23
-
24
-
25
-
26
-
27
-
28
-
29
-
30
-
31
-
32
-
33
-
34
-
35
-
36
-
37
-
38
-
39
-
40
-
41
-
42
-
43
-
 44
44 -
 45
45 -
 46
46 -
 47
47 -
 48
48 -
 49
49 -
 50
50 -
 51
51 -
 52
52 -
 53
53 -
 54
54 -
 55
55 -
 56
56 -
 57
57 -
 58
58 -
 59
59 -
 60
60 -
 61
61 -
 62
62 -
 63
63 -
 64
64 -
65
-
66
-
67
-
68
-
69
-
70
-
71
-
72
-
73
-
74
-
75
-
76
-
77
-
78
-
79
-
80
-
81
-
82
-
83
-
84
-
85
-
86
-
87
-
88
-
89
-
90
-
91
-
92
-
93
-
94
-
95
-
96
-
97
-
98
-
99
-
100
-
101
-
102
-
103
-
104
-
105
-
106
-
107
-
108
-
109
-
110
-
111
-
112
-
113
-
114
-
115
-
116
-
117
-
118
-
119
-
120
-
121
-
122
-
123
-
124
-
125
-
126
-
127
-
128
-
129
-
130
-
131
-
132
-
133
-
134
-
135
-
136
-
137
-
138
-
139
-
140
-
141
-
142
-
143
-
144
-
145
-
146
-
147
-
148
-
149
-
150
-
151
-
152
-
153
-
154
-
155
-
156
-
157
-
158
-
159
-
160
-
161
-
162
 |
 |

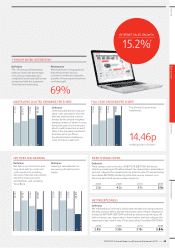
Group Return on Capital Employed (ROCE) increased substantially
– to 12.9% (last year 12.1%). We expect to deliver our target increase
of 200 basis points, on our 2005/6 base of 12.6%, by 2014/15, taking
ROCE to 14.6%. This increase will be driven predominantly by
operational improvement – growth in asset turnover and margin –
combined with improved capital efficiency (work in progress release
and our property programme). By geography and business segment,
the increases in ROCE will be broadly based, coming from Asia, Europe,
the US, the UK and Tesco Bank.
The Board has proposed a final dividend of 10.09p per share, taking
the full-year dividend to 14.46p. This represents an increase of 10.8%
on last year’s full-year dividend, which is in line with the growth in
underlying diluted earnings per share at constant tax rates. It is also
the 27th consecutive year of dividend increase. The final dividend will
be paid on 8 July 2011 to shareholders on the Register of Members at
the close of business on 3 May 2011.
* EBITDAR defined as statutory profit before interest, tax, depreciation, amortisation
and rent.
Group sales, including VAT, increased by 8.1% to £67.6 billion.
At constant exchange rates, sales increased by 6.6% (including
petrol) and 6.0% (excluding petrol).
Group trading profit was £3,679 million, up 7.8% on last year
and Group trading margin, at 6.0%, increased by 4 basis points.
Underlying profit before tax rose to £3,813 million, an increase
of 12.3%. Before property, underlying profit before tax grew by
12.2%. On a statutory basis, Group operating profit rose by
10.2% to £3,811 million. Group profit before tax increased 11.3%
to £3,535 million.
Net finance costs increased to £333 million (£314 million last year).
However, before the non-cash IAS 19, 32, and 39 adjustments, actual
net interest cost fell by £83 million to £334 million. This reflects the
continued reduction in net debt.
Total Group tax has been charged at an effective rate of 24.4% (last
year 26.4%). This reduction was largely driven by a reduction in the
rate of UK corporation tax, and a lower Japan impairment than last
year. We expect the tax rate for 2011/12 to be broadly unchanged.
Cash Flow and Balance Sheet. Net debt reduced to £6.8 billion,
ahead of our target of £7.0 billion, helped by strong cash generation
in the seasonally important second half of the year. During the year,
we repaid £926 million of our debt early and repaid £777 million of
maturing bonds. The strength of our property-backed balance sheet
was again demonstrated through continued strong investor demand
for our property sale and leaseback transactions during the year.
We expect net debt to fall further in the years ahead. Looking at our
liabilities in the round, we will be focusing more on fixed charge cover
as our primary balance sheet metric, which we are targeting to keep
between 4 and 4.5 times. We also are targeting a ratio of 2.5 times
lease-adjusted net debt to EBITDAR* which represents a similar level
to where we were prior to the Homever and TPF acquisitions.
Group capital expenditure in the year was £3.7 billion (last year
£3.1 billion), a little higher than our expectation at the beginning
of the year, mainly as a result of exchange rate movements. Capital
expenditure in the UK was £1.7 billion, with an additional £0.2 billion
in the Bank, principally for the re-platforming of our systems, and
£1.8 billion in International. For the 2011/12 year we plan to invest
around £4.0 billion in capital expenditure and going forward we
expect annual capital expenditure to total between 5% and 5.5%
of Group sales.
50
—
TESCO PLC Annual Report and Financial Statements 2011
Heading
BUSINESS REVIEW
Group financials