Tesco 2011 Annual Report Download - page 29
Download and view the complete annual report
Please find page 29 of the 2011 Tesco annual report below. You can navigate through the pages in the report by either clicking on the pages listed below, or by using the keyword search tool below to find specific information within the annual report.-
 1
1 -
2
-
3
-
4
-
5
-
6
-
7
-
8
-
9
-
10
-
11
-
12
-
13
-
14
-
15
-
16
-
17
-
18
-
 19
19 -
 20
20 -
 21
21 -
 22
22 -
 23
23 -
 24
24 -
 25
25 -
 26
26 -
 27
27 -
 28
28 -
 29
29 -
 30
30 -
 31
31 -
 32
32 -
 33
33 -
 34
34 -
 35
35 -
 36
36 -
 37
37 -
 38
38 -
 39
39 -
40
-
41
-
42
-
43
-
44
-
45
-
46
-
47
-
48
-
49
-
50
-
51
-
52
-
53
-
54
-
55
-
56
-
57
-
58
-
59
-
60
-
61
-
62
-
63
-
64
-
65
-
66
-
67
-
68
-
69
-
70
-
71
-
72
-
73
-
74
-
75
-
76
-
77
-
78
-
79
-
80
-
81
-
82
-
83
-
84
-
85
-
86
-
87
-
88
-
89
-
90
-
91
-
92
-
93
-
94
-
95
-
96
-
97
-
98
-
99
-
100
-
101
-
102
-
103
-
104
-
105
-
106
-
107
-
108
-
109
-
110
-
111
-
112
-
113
-
114
-
115
-
116
-
117
-
118
-
119
-
120
-
121
-
122
-
123
-
124
-
125
-
126
-
127
-
128
-
129
-
130
-
131
-
132
-
133
-
134
-
135
-
136
-
137
-
138
-
139
-
140
-
141
-
142
-
143
-
144
-
145
-
146
-
147
-
148
-
149
-
150
-
151
-
152
-
153
-
154
-
155
-
156
-
157
-
158
-
159
-
160
-
161
-
162
 |
 |

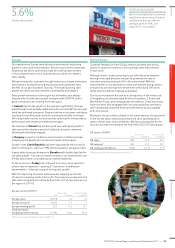
Europe
Our operations in Europe have delivered record results and strong
growth in sales, profits and margins. Recovering economies generally
helped but key to this performance was the striking improvement
in the competitiveness of our local businesses, which won market
share rapidly.
We have invested for customers through lower prices, sharper promotions
and Clubcard, funded by strong productivity and substantial early
benefits of our pan-European sourcing. The resulting strong sales
growth has driven an improvement in profitability and margins.
Sales growth varied across the region but all markets saw sharply
improved like-for-like sales growth compared with 2009/10, with a
good contribution also coming from new space.
In Ireland, like-for-like growth in the year was significantly stronger,
and although it was broadly stable during the second half, the two-year
trend has continued to improve. Despite a decline in consumer confidence
resulting from political and economic uncertainty and the continued
fall in disposable income, our business has continued its strong relative
performance with impressive market share gains.
Our business in Poland had another good year, with good growth in
sales and profits despite a period of subdued consumer sentiment
following the Smolensk tragedy.
In Hungary economic conditions and consumer confidence remain
challenging but despite this our business made solid progress.
Growth in the Czech Republic has been supported by the successful
launch of Clubcard – with over 10% of the population already enrolled.
A particularly strong performance in Slovakia with double-digit like-for-
like sales growth – has led to a further increase in our market share over
the last year, further consolidating our market leadership.
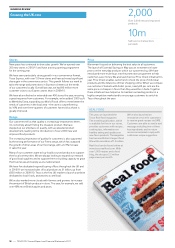
As the economy in Turkey has continued to recover, we’ve resumed
a faster rate of expansion – opening 21 new stores, including ten
hypermarkets – helping to support strong sales growth.
With the improving economic outlook we are stepping up the rate
of new store opening. Some 2.6m sq ft of new space was opened in the
year, with a programme to add a further 2.9m sq ft of new space across
the region in 2011/12.
Europe results 2010/11
£m
Actual rates
% growth
Constant rates
% growth
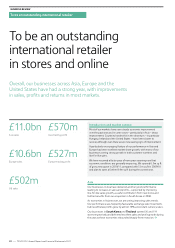
Europe sales 10,558 5.6 7.4
Europe revenue*9,192 5.4 7.1
Europe trading profit 527 11.2 13.7
Trading margin
(trading profit/revenue) 5.73% 30bp 42bp
United States
Customer feedback at Fresh & Easy remains excellent and strong
growth in customer numbers is driving steady sales improvement
in each store.
Although there is clearly some way to go, with these key elements
moving in the right direction, we plan to accelerate the rate of
new store openings to around 50 in the current year. With the
improvements in our distribution centre and manufacturing campus
productivity, we now expect to break-even with around 300 stores
rather than the 400 we originally anticipated.
Our losses increased in the year as a consequence of the initial costs
of integrating our two dedicated fresh food suppliers, 2 Sisters and
Wild Rocket Foods, and exchange rate movements. These businesses
have now been fully integrated with our existing kitchen operations,
with substantially improved financial performance, product quality
and service levels.
We expect losses to reduce sharply in the current year as strong growth
in like-for-like sales continues and improved store operating ratios
start to deliver shop-door profitability. We have a strong plan for the
business to break-even towards the end of the 2012/13 financial year.
US results 2010/11
£m
Actual rates
% growth
Constant rates
% growth
US sales 502 41.8 38.1
US revenue*495 41.8 38.1
US trading profit/(loss) (186) (12.7) (9.7)
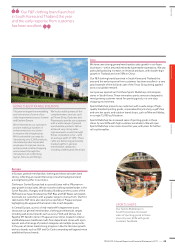
EXTRAS IN EUROPE
We’ve remodelled and converted
eight Extra stores across Central
and Eastern Europe with an
average uplift of 16%. See
page 29 for more detail.
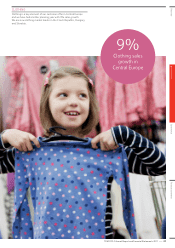
5.6%
Europe sales growth
* Revenue excludes VAT and the impact of IFRIC 13.
* Revenue excludes VAT and the impact of IFRIC 13.
TESCO PLC Annual Report and Financial Statements 2011
—
25
Overview Business review Governance Financial statements