Tesco 2011 Annual Report Download - page 52
Download and view the complete annual report
Please find page 52 of the 2011 Tesco annual report below. You can navigate through the pages in the report by either clicking on the pages listed below, or by using the keyword search tool below to find specific information within the annual report.-
 1
1 -
2
-
3
-
4
-
5
-
6
-
7
-
8
-
9
-
10
-
11
-
12
-
13
-
14
-
15
-
16
-
17
-
18
-
19
-
20
-
21
-
22
-
23
-
24
-
25
-
26
-
27
-
28
-
29
-
30
-
31
-
32
-
33
-
34
-
35
-
36
-
37
-
38
-
39
-
40
-
41
-
 42
42 -
 43
43 -
 44
44 -
 45
45 -
 46
46 -
 47
47 -
 48
48 -
 49
49 -
 50
50 -
 51
51 -
 52
52 -
 53
53 -
 54
54 -
 55
55 -
 56
56 -
 57
57 -
 58
58 -
 59
59 -
 60
60 -
 61
61 -
 62
62 -
63
-
64
-
65
-
66
-
67
-
68
-
69
-
70
-
71
-
72
-
73
-
74
-
75
-
76
-
77
-
78
-
79
-
80
-
81
-
82
-
83
-
84
-
85
-
86
-
87
-
88
-
89
-
90
-
91
-
92
-
93
-
94
-
95
-
96
-
97
-
98
-
99
-
100
-
101
-
102
-
103
-
104
-
105
-
106
-
107
-
108
-
109
-
110
-
111
-
112
-
113
-
114
-
115
-
116
-
117
-
118
-
119
-
120
-
121
-
122
-
123
-
124
-
125
-
126
-
127
-
128
-
129
-
130
-
131
-
132
-
133
-
134
-
135
-
136
-
137
-
138
-
139
-
140
-
141
-
142
-
143
-
144
-
145
-
146
-
147
-
148
-
149
-
150
-
151
-
152
-
153
-
154
-
155
-
156
-
157
-
158
-
159
-
160
-
161
-
162
 |
 |

* All KPIs are for 52 weeks ended 26 February 2011, 52 weeks ended 27 February 2010,
53 weeks ended 28 February 2009 and 52 weeks ended 23 February 2008 unless
otherwise stated.
** Restated for IFRS 2 and IFRIC 13.
± Using ‘normalised’ tax rate before the start-up costs in the US and Tesco Direct, and
excludes the impact of foreign exchange in equity and our acquisition of a majority
share in Dobbies.
† Internet sales growth defined as total tesco.com and online telecoms sales growth.
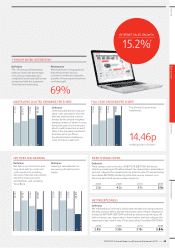
TOTAL SHAREHOLDER RETURN
Definition
Total shareholder return is the
notional return from a share and
is measured as the percentage
change in the share price, plus
the dividends paid. This is
measured over the last five years.
CAPITAL EXPENDITURE
Definition
The additions to property,
plant and equipment,
investment property and
intangible assets.
RETURN ON CAPITAL EMPLOYED (ROCE)
Definition
ROCE is defined as profit before
interest after tax divided by the
calculated average of net assets
plus net debt plus dividend
creditor less net assets held
for resale. ROCE is a relative
profit measurement that not
only incorporates the funds
shareholders have invested,
but also funds invested by banks
and other lenders, and therefore
shows the productivity of the
assets of the Group.
Performance
ROCE increased substantially to
12.9% (last year 12.1%) driven
by operational improvements in
the form of strong profit growth,
improved working capital and
greater capital efficiency as a
result of our sale and leaseback
programme. We have set
ourselves a target of increasing
ROCE to 14.6% by 2014/15.
22.8%
8.0%
9.5%
6.7%
08 09 10 11
£3.9bn
£4.7bn
£3.1bn
£3.7bn
Tesco Bank
Asia, Europe, US
UK 08
£2.3bn £1.6bn
09
£2.6bn £2.1bn
10
£1.5bn £1.5bn £0.1bn
11
£1.7bn £1.8bn £0.2bn
SALES AND PROFIT GROWTH
2008 2009 2010 2011
Group sales growth (inc. VAT) 11.1% 15.1% 6.8% 8.1%
UK sales growth (inc. VAT) 6.7% 9.5% 4.2% 5.5%
International sales growth (inc. VAT) 25.3% 30.6% 8.8% 13.7%
Profit before tax 5.7% 4.1%** 8.9% 11.3%
Underlying profit before tax 11.8% 9.8%** 8.7% 12.3%
How did we do?
2008 2009 2010 2011
12.9%±12.8%** 12.1% 12.9%
REDUCTION IN CO2 EMISSIONS
Definition
This measure shows the overall year-on-year reduction in greenhouse
gas emissions from existing stores and distribution centres built before
2006/7, adjusted to exclude emissions from acquisitions and extensions.
2008 2009 2010 2011
4.6% 4.8% 7.8% 7.7%
REDUCTION IN CO2 EMISSIONS INTENSITY OF NEW
STORES AND DISTRIBUTION CENTRES
Definition
Intensity is measured as greenhouse gas emissions/sq ft. The measure
indicates the average reduction in emissions intensity of all new stores
and distribution centres built since 2006/7 (the base year).
2008 2009 2010 2011
14.7% 25.3% 28.8% 28.8%
48
—
TESCO PLC Annual Report and Financial Statements 2011
BUSINESS REVIEW
Key performance indicators