Tesco 2011 Annual Report Download - page 150
Download and view the complete annual report
Please find page 150 of the 2011 Tesco annual report below. You can navigate through the pages in the report by either clicking on the pages listed below, or by using the keyword search tool below to find specific information within the annual report.-
 1
1 -
2
-
3
-
4
-
5
-
6
-
7
-
8
-
9
-
10
-
11
-
12
-
13
-
14
-
15
-
16
-
17
-
18
-
19
-
20
-
21
-
22
-
23
-
24
-
25
-
26
-
27
-
28
-
29
-
30
-
31
-
32
-
33
-
34
-
35
-
36
-
37
-
38
-
39
-
40
-
41
-
42
-
43
-
44
-
45
-
46
-
47
-
48
-
49
-
50
-
51
-
52
-
53
-
54
-
55
-
56
-
57
-
58
-
59
-
60
-
61
-
62
-
63
-
64
-
65
-
66
-
67
-
68
-
69
-
70
-
71
-
72
-
73
-
74
-
75
-
76
-
77
-
78
-
79
-
80
-
81
-
82
-
83
-
84
-
85
-
86
-
87
-
88
-
89
-
90
-
91
-
92
-
93
-
94
-
95
-
96
-
97
-
98
-
99
-
100
-
101
-
102
-
103
-
104
-
105
-
106
-
107
-
108
-
109
-
110
-
111
-
112
-
113
-
114
-
115
-
116
-
117
-
118
-
119
-
120
-
121
-
122
-
123
-
124
-
125
-
126
-
127
-
128
-
129
-
130
-
131
-
132
-
133
-
134
-
135
-
136
-
137
-
138
-
139
-
 140
140 -
 141
141 -
 142
142 -
 143
143 -
 144
144 -
 145
145 -
 146
146 -
 147
147 -
 148
148 -
 149
149 -
 150
150 -
 151
151 -
 152
152 -
 153
153 -
 154
154 -
 155
155 -
 156
156 -
 157
157 -
 158
158 -
 159
159 -
 160
160 -
161
-
162
 |
 |

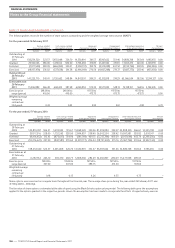
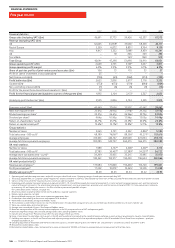
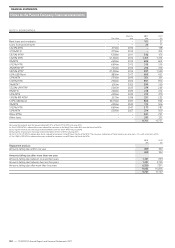
2007 2008 2009 2010 2011
Financial statistics
Group sales (including VAT) (£m) 46,611 51,773 59,426 62,537 67,573
Revenue (excluding VAT) (£m)
UK 32,665 34,858537,650238,558 40,117
Rest of Europe 5,559 6,872 8,83148,704 9,159
Asia 4,417 5,552 7,04828,439 10,241
US – 165206 349 495
Tesco Bank – – 1635860 919
Total Group 42,641 47,298 53,898 56,910 60,931
Group operating profit1 (£m) 2,648 2,791 3,16923,457 3,811
Group operating profit margin16.2% 5.9% 5.9% 6.1% 6.3%
Share of post-tax profits of joint ventures and associates (£m) 106 75 110 33 57
Profit on sale of investment in associates (£m) 25 – – – –
Net finance costs (£m) (126) (63) (362) (314) (333)
Profit before tax (£m) 2,653 2,803 2,91723,176 3,535
Taxation (£m) (772) (673) (779) (840) (864)
Non-controlling interests (£m) (7) (6) (5) (9) (16)
Profit for the period from discontinued operation3,4 (£m) 18 – – – –
Profit for the financial year attributable to owners of the parent (£m) 1,892 2,124 2,13322,327 2,655
Underlying profit before tax4 (£m) 2,545 2,846 3,124 3,395 3,813
Enterprise value6 (£m) 40,469 37,656 35,907 41,442 39,462
Basic earnings per share723.61p 26.95p 27.14p229.33p 33.10p
Diluted earnings per share723.31p 26.61p 26.96p229.19p 32.94p
Dividend per share89.64p 10.90p 11.96p 13.05p 14.46p
Return on shareholders’ funds926.7% 25.1% 23.5%223.0% 22.6%
Return on capital employed10 12.6%
15 12.7%16 12.8%
18 12.1% 12.9%
Group statistics
Number of stores 3,263 3,751 4,332 4,83619 5,380
Total sales area – 000 sq ft11 68,189 76,86719 88,55619 95,23120 103,616
Average employees 413,061 444,127 468,508 472,094 492,714
Average full-time equivalent employees 318,283 345,737 364,015 366,413 384,389
UK retail statistics
Number of stores 1,988 2,13719 2,30619 2,50719 2,715
Total sales area – 000 sq ft11 27,785 30,45719 32,38919 34,23720 36,722
Average store size (sales area – sq ft)12 34,209 35,055 35,215 35,485 35,970
Average full-time equivalent employees 184,461 193,917 194,420 196,604 200,966
UK retail productivity (£)
Revenue per employee13 177,084 179,840 196,4362196,120 199,621
Profit per employee13 11,292 10,814
17 13,065214,303 15,098
Weekly sales per sq ft14 25.48 25.43 25.34 25.22 24.95
1 Operating profit includes integration costs and profit arising on sale of fixed assets. Operating margin is based upon revenue excluding VAT.
2 The Group adopted IFRIC 13 ‘Customer Loyalty Programmes’ and the amendments to IFRS 2 ‘Share-Based Payment’ from 24 February 2008. Periods before this date have not been restated.
3 Consists of the net result of the Taiwanese business which was sold during 2007.
4 Underlying profit excludes the impact of non-cash elements of IAS 17, 19, 32 and 39 (principally the impact of annual uplifts in rents and rent free period, pension cost, and the marking to
market of financial instruments); the amortisation charge on intangible assets arising on acquisition, acquisition costs and the non-cash impact of IFRIC 13. It also exclude costs relating to
restructuring (US and Japan), closure costs, (Vin Plus) and the impairment of goodwill in Japan.
For further details of this measure, see page 105.
5 Results have been restated to reflect the US and Tesco Bank as separate segments.
6 Market capitalisation plus net debt.
7 Basic and diluted earnings per share are on a continuing operations basis.
8 Dividend per share relating to the interim and proposed final dividend.
9 Profit before tax divided by average shareholders’ funds.
10 The numerator is profit before interest, less tax. The denominator is the calculated average of net assets plus net debt plus dividend creditor less net assets held for sale.
11 Store sizes exclude lobby and restaurant areas.
12 Average store size excludes Express, One Stop and Dobbies stores.
13 Based on average number of full-time equivalent employees in the UK, revenue exclusive of VAT and operating profit.
14 Based on weighted average sales area and average weekly sales, excluding Dobbies stores.
15 Excludes one-off gain from ‘Pensions A-Day’. With this one-off gain, ROCE was 13.6%.
16 Using a ‘normalised’ tax rate before start-up costs in the US and Tesco Direct and excluding the impact of foreign exchange in equity and our acquisition of a majority share of Dobbies.
17 Excluding start-up costs in the US and Tesco Direct and adjusting average number of full-time equivalent employees in the UK to exclude US and Tesco Direct employees – profit per
employee would be £11,317.
18 Excluding acquisition of Tesco Bank and Homever, India start-up costs, and after adjusting for assets held for sale. Calculated on a 52-week basis, ROCE for 2009 is 12.8%.
19 Restated to include Dobbies stores.
20 Restated to include Dobbies stores and account for a space restatement of 109,000 sq ft driven by a comprehensive remeasurement of One Stop stores.
FINANCIAL STATEMENTS
146
—
TESCO PLC Annual Report and Financial Statements 2011
Five year record