Tesco 2011 Annual Report Download - page 26
Download and view the complete annual report
Please find page 26 of the 2011 Tesco annual report below. You can navigate through the pages in the report by either clicking on the pages listed below, or by using the keyword search tool below to find specific information within the annual report.-
 1
1 -
2
-
3
-
4
-
5
-
6
-
7
-
8
-
9
-
10
-
11
-
12
-
13
-
14
-
15
-
 16
16 -
 17
17 -
 18
18 -
 19
19 -
 20
20 -
 21
21 -
 22
22 -
 23
23 -
 24
24 -
 25
25 -
 26
26 -
 27
27 -
 28
28 -
 29
29 -
 30
30 -
 31
31 -
 32
32 -
 33
33 -
 34
34 -
 35
35 -
 36
36 -
37
-
38
-
39
-
40
-
41
-
42
-
43
-
44
-
45
-
46
-
47
-
48
-
49
-
50
-
51
-
52
-
53
-
54
-
55
-
56
-
57
-
58
-
59
-
60
-
61
-
62
-
63
-
64
-
65
-
66
-
67
-
68
-
69
-
70
-
71
-
72
-
73
-
74
-
75
-
76
-
77
-
78
-
79
-
80
-
81
-
82
-
83
-
84
-
85
-
86
-
87
-
88
-
89
-
90
-
91
-
92
-
93
-
94
-
95
-
96
-
97
-
98
-
99
-
100
-
101
-
102
-
103
-
104
-
105
-
106
-
107
-
108
-
109
-
110
-
111
-
112
-
113
-
114
-
115
-
116
-
117
-
118
-
119
-
120
-
121
-
122
-
123
-
124
-
125
-
126
-
127
-
128
-
129
-
130
-
131
-
132
-
133
-
134
-
135
-
136
-
137
-
138
-
139
-
140
-
141
-
142
-
143
-
144
-
145
-
146
-
147
-
148
-
149
-
150
-
151
-
152
-
153
-
154
-
155
-
156
-
157
-
158
-
159
-
160
-
161
-
162
 |
 |

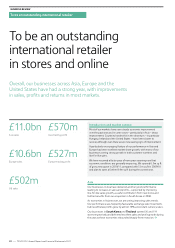
Overall, our businesses across Asia, Europe and the
United States have had a strong year, with improvements
in sales, profits and returns in most markets.
Introduction and market context
Most of our markets have seen steady economic improvement
over the past year and in some cases – particularly in Asia – sharp
improvement. Countries hardest hit in the downturn – in particular
Hungary, Ireland and the United States – have been slower to
recover, although even there we are now seeing signs of improvement.
A particularly encouraging feature of our performance in Asia and
Europe has been excellent market share growth, with many of our
businesses seeing strong growth in both customer numbers and
like-for-like sales.
We have resumed a faster pace of new space opening now that
economic conditions are generally improving. We opened 6.5m sq ft
of gross new space in 2010/11, compared with 5.1m sq ft in 2009/10
and plan to open a further 8.4m sq ft during the current year.
Asia
Our businesses in Asia have delivered another good performance
leading to increases in sales and profits – supported by improving
like-for-like sales growth, a useful contribution from new stores and
further benefits from our acquisition in South Korea in 2008.
As economies in Asia recover, we are seeing improving sales trends.
Our performance was helped by favourable exchange rate movements
but nevertheless profits grew by almost 18% at constant currency rates.
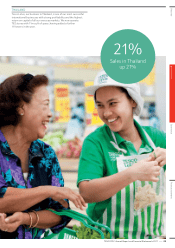
Our businesses in South Korea and Thailand opened 56 and 119
stores respectively and delivered excellent sales and profit growth during
the year as these economies rebounded sharply from recession.
To be an outstanding
international retailer
in stores and online
£11.0bn
Asia sales
£10.6bn
Europe sales
£502m
US sales
£527m
Europe trading profit
£570m
Asia trading profit
22
—
TESCO PLC Annual Report and Financial Statements 2011
BUSINESS REVIEW
To be an outstanding international retailer