Tesco 2011 Annual Report Download - page 110
Download and view the complete annual report
Please find page 110 of the 2011 Tesco annual report below. You can navigate through the pages in the report by either clicking on the pages listed below, or by using the keyword search tool below to find specific information within the annual report.-
 1
1 -
2
-
3
-
4
-
5
-
6
-
7
-
8
-
9
-
10
-
11
-
12
-
13
-
14
-
15
-
16
-
17
-
18
-
19
-
20
-
21
-
22
-
23
-
24
-
25
-
26
-
27
-
28
-
29
-
30
-
31
-
32
-
33
-
34
-
35
-
36
-
37
-
38
-
39
-
40
-
41
-
42
-
43
-
44
-
45
-
46
-
47
-
48
-
49
-
50
-
51
-
52
-
53
-
54
-
55
-
56
-
57
-
58
-
59
-
60
-
61
-
62
-
63
-
64
-
65
-
66
-
67
-
68
-
69
-
70
-
71
-
72
-
73
-
74
-
75
-
76
-
77
-
78
-
79
-
80
-
81
-
82
-
83
-
84
-
85
-
86
-
87
-
88
-
89
-
90
-
91
-
92
-
93
-
94
-
95
-
96
-
97
-
98
-
99
-
 100
100 -
 101
101 -
 102
102 -
 103
103 -
 104
104 -
 105
105 -
 106
106 -
 107
107 -
 108
108 -
 109
109 -
 110
110 -
 111
111 -
 112
112 -
 113
113 -
 114
114 -
 115
115 -
 116
116 -
 117
117 -
 118
118 -
 119
119 -
 120
120 -
121
-
122
-
123
-
124
-
125
-
126
-
127
-
128
-
129
-
130
-
131
-
132
-
133
-
134
-
135
-
136
-
137
-
138
-
139
-
140
-
141
-
142
-
143
-
144
-
145
-
146
-
147
-
148
-
149
-
150
-
151
-
152
-
153
-
154
-
155
-
156
-
157
-
158
-
159
-
160
-
161
-
162
 |
 |

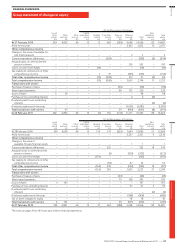
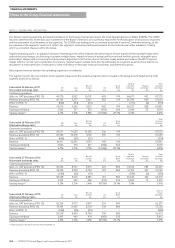
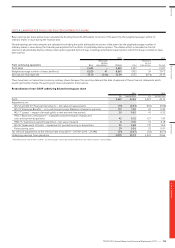
NOTE 2 SEGMENTAL REPORTING
The Group’s reporting segments are determined based on the Group’s internal reporting to the Chief Operating Decision Maker (CODM). The CODM
has been determined to be the Executive Committee of the Board of Directors as it is primarily responsible for the allocation of resources to segments
and the assessment of performance of the segments. The CODM uses trading profit, as reviewed at monthly Executive Committee meetings, as the
key measure of the segments’ results as it reflects the segments’ underlying trading performance for the financial year under evaluation. Trading
profit is a consistent measure within the Group.
Segmental trading profit is an adjusted measure of operating profit, which measures the performance of each segment before goodwill impairment
and restructuring charges, profit arising on property-related items, impact on leases of annual uplifts in rent and rent-free periods, intangible asset
amortisation charges and costs arising from acquisitions, adjustments for the fair value of customer loyalty awards and replaces the IAS 19 pension
charge with the ‘normal’ cash contributions for pensions. Segment assets include items directly attributable to a segment as well as those that can be
allocated on a reasonable basis. Unallocated is comprised mainly of derivative financial instruments and deferred tax assets.
Inter-segment revenue between the operating segments is not material.
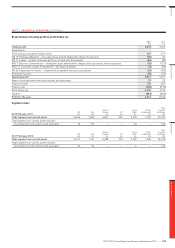
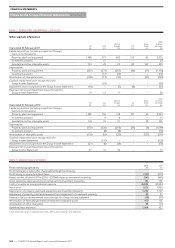
The segment results, the reconciliation of the segment measures to the respective statutory items included in the Group Income Statement and the
segment assets are as follows:
Year ended 26 February 2011
At constant exchange rates UK
£m
Asia
£m
Rest of
Europe
£m
US
£m
Tesco
Bank
£m
Total at
constant
exchange
£m
Foreign
exchange
£m
Total
at actual
exchange
£m
Continuing operations
Sales inc. VAT (excluding IFRIC 13) 44,570 9,952 10,741 489 919 66,671 902 67,573
Revenue (excluding IFRIC 13) 40,765 9,277 9,347 482 919 60,790 860 61,650
Effect of IFRIC 13 (649) (34) (34) – – (717) (2) (719)
Revenue 40,116 9,243 9,313 482 919 60,073 858 60,931
Trading profit/(loss) 2,505 517 539 (181) 264 3,644 35 3,679
Trading margin* 6.1% 5.6% 5.8% (37.6%) 28.7% 6.0% 6.0%
Year ended 26 February 2011
At actual exchange rates UK
£m
Asia
£m
Rest of
Europe
£m
US
£m
Tesco
Bank
£m
Total
at actual
exchange
£m
Continuing operations
Sales inc. VAT (excluding IFRIC 13) 44,571 11,023 10,558 502 919 67,573
Revenue (excluding IFRIC 13) 40,766 10,278 9,192 495 919 61,650
Effect of IFRIC 13 (649) (37) (33) – – (719)
Revenue 40,117 10,241 9,159 495 919 60,931
Trading profit/(loss) 2,504 570 527 (186) 264 3,679
Trading margin* 6.1% 5.5% 5.7% (37.6%) 28.7% 6.0%
Year ended 27 February 2010
At constant exchange rates UK
£m
Asia
£m
Rest of
Europe
£m
US
£m
Tesco
Bank
£m
Total at
constant
exchange
£m
Foreign
exchange
£m
Total
at actual
exchange
£m
Continuing operations
Sales inc. VAT (excluding IFRIC 13) 42,254 8,737 9,979 324 860 62,154 383 62,537
Revenue (excluding IFRIC 13) 39,104 8,148 8,704 319 860 57,135 367 57,502
Effect of IFRIC 13 (546) (25) (19) – – (590) (2) (592)
Revenue 38,558 8,123 8,685 319 860 56,545 365 56,910
Trading profit/(loss) 2,413 422 466 (151) 250 3,400 12 3,412
Trading margin* 6.2% 5.2% 5.4% (47.3%) 29.1% 5.9% 5.9%
Year ended 27 February 2010
At actual exchange rates UK
£m
Asia
£m
Rest of
Europe
£m
US
£m
Tesco
Bank
£m
Total at
actual
exchange
£m
Continuing operations
Sales inc. VAT (excluding IFRIC 13) 42,254 9,072 9,997 354 860 62,537
Revenue (excluding IFRIC 13) 39,104 8,465 8,724 349 860 57,502
Effect of IFRIC 13 (546) (26) (20) – – (592)
Revenue 38,558 8,439 8,704 349 860 56,910
Trading profit/(loss) 2,413 440 474 (165) 250 3,412
Trading margin* 6.2% 5.2% 5.4% (47.3%) 29.1% 5.9%
* Trading margin is based on revenue excluding IFRIC 13.
FINANCIAL STATEMENTS
106
—
TESCO PLC Annual Report and Financial Statements 2011
Notes to the Group financial statements