Tesco 2011 Annual Report Download - page 90
Download and view the complete annual report
Please find page 90 of the 2011 Tesco annual report below. You can navigate through the pages in the report by either clicking on the pages listed below, or by using the keyword search tool below to find specific information within the annual report.-
 1
1 -
2
-
3
-
4
-
5
-
6
-
7
-
8
-
9
-
10
-
11
-
12
-
13
-
14
-
15
-
16
-
17
-
18
-
19
-
20
-
21
-
22
-
23
-
24
-
25
-
26
-
27
-
28
-
29
-
30
-
31
-
32
-
33
-
34
-
35
-
36
-
37
-
38
-
39
-
40
-
41
-
42
-
43
-
44
-
45
-
46
-
47
-
48
-
49
-
50
-
51
-
52
-
53
-
54
-
55
-
56
-
57
-
58
-
59
-
60
-
61
-
62
-
63
-
64
-
65
-
66
-
67
-
68
-
69
-
70
-
71
-
72
-
73
-
74
-
75
-
76
-
77
-
78
-
79
-
 80
80 -
 81
81 -
 82
82 -
 83
83 -
 84
84 -
 85
85 -
 86
86 -
 87
87 -
 88
88 -
 89
89 -
 90
90 -
 91
91 -
 92
92 -
 93
93 -
 94
94 -
 95
95 -
 96
96 -
 97
97 -
 98
98 -
 99
99 -
 100
100 -
101
-
102
-
103
-
104
-
105
-
106
-
107
-
108
-
109
-
110
-
111
-
112
-
113
-
114
-
115
-
116
-
117
-
118
-
119
-
120
-
121
-
122
-
123
-
124
-
125
-
126
-
127
-
128
-
129
-
130
-
131
-
132
-
133
-
134
-
135
-
136
-
137
-
138
-
139
-
140
-
141
-
142
-
143
-
144
-
145
-
146
-
147
-
148
-
149
-
150
-
151
-
152
-
153
-
154
-
155
-
156
-
157
-
158
-
159
-
160
-
161
-
162
 |
 |

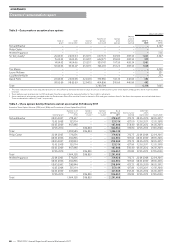
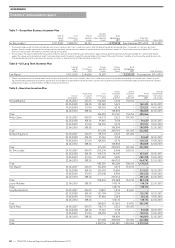
Table 3 – Gains made on executive share options
Value realisable1,3
Date of
grant
Date
exercisable
Date of
exercise
Number of
options
exercised
Option
price
(pence)
Market
price at
exercise
(pence)
2010/11
£000
2009/10
£000
Richard Brasher – – – – – – – 2,127
Philip Clarke – – – – – – – –
Andrew Higginson – – – – – – – 503
Sir Terry Leahy226.04.01 26.04.04 23.02.11 647,773 247.00 408.34 1,045 2,327
15.04.02 15.04.05 23.02.11 642,471 259.00 408.34 959
14.04.03 14.04.06 23.02.11 939,747 197.50 408.34 1,981
30.04.04 30.04.07 23.02.11 766,041 253.25 408.34 1,188
Tim Mason – – – – – – – 2,220
Laurie McIlwee – – – – – – – 231
Lucy Neville-Rolfe – – – – – – – 257
David Potts 22.04.05 22.04.08 22.04.10 379,856 312.75 440.00 483 –
08.05.06 08.05.09 22.04.10 404,896 318.60 440.00 492
Total 3,780,784 6,148 7,665
1 The value realisable from shares acquired on exercise is the difference between the market value at exercise and the exercise price of the option, although the shares may have been
retained.
2 These options were granted prior to 2005 and were therefore required to be exercised before Sir Terry Leahy’s retirement.
3 Gains made on nil cost options awarded under the Performance Share Plan and the Executive Incentive Plan and gains made on Save As You Earn share options are not included above.
These are detailed in tables 6, 9 and 5 respectively.
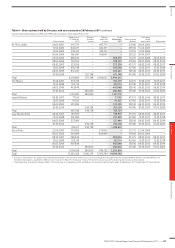
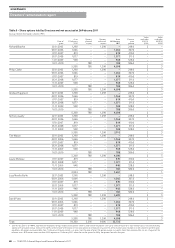
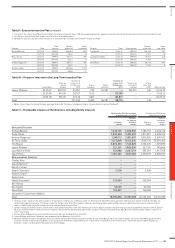
Table 4 – Share options held by Directors and not exercised at 26 February 2011
Executive Share Option Scheme (1994) and (1996) and Discretionary Share Option Plan (2004)
Date of grant
Options as at
27 February
2010
Options
granted
in year1
Options
exercised
in year2
As at
26 February
2011
Exercise price
(pence)
Date from
which
exercisable Expiry date
Richard Brasher 08.05.2007 278,627 – – 278,627 473.75 08.05.2010 08.05.2017
12.05.2008 353,114 – – 353,114 427.00 12.05.2011 12.05.2018
06.05.2009 467,848 – – 467,848 338.40 06.05.2012 06.05.2019
07.05.2010 – 386,850 – 386,850 419.80 07.05.2013 07.05.2020
Total 1,099,589 386,850 – 1,486,439
Philip Clarke 22.04.2005 379,856 – – 379,856 312.75 22.04.2008 22.04.2015
08.05.2006 404,896 – – 404,896 318.60 08.05.2009 08.05.2016
08.05.2007 298,844 – – 298,844 473.75 08.05.2010 08.05.2017
12.05.2008 353,114 – – 353,114 427.00 12.05.2011 12.05.2018
06.05.2009 467,848 – – 467,848 338.40 06.05.2012 06.05.2019
07.05.2010 – 386,850 – 386,850 419.80 07.05.2013 07.05.2020
Total 1,904,558 386,850 – 2,291,408
Andrew Higginson 22.04.2005 379,856 – – 379,856 312.75 22.04.2008 22.04.2015
08.05.2006 404,896 – – 404,896 318.60 08.05.2009 08.05.2016
08.05.2007 298,844 – – 298,844 473.75 08.05.2010 08.05.2017
12.05.2008 353,114 – – 353,114 427.00 12.05.2011 12.05.2018
06.05.2009 467,848 – – 467,848 338.40 06.05.2012 06.05.2019
07.05.2010 – 386,850 – 386,850 419.80 07.05.2013 07.05.2020
Total 1,904,558 386,850 – 2,291,408
Directors’ remuneration report
GOVERNANCE
86
—
TESCO PLC Annual Report and Financial Statements 2011