Tesco 2011 Annual Report Download - page 101
Download and view the complete annual report
Please find page 101 of the 2011 Tesco annual report below. You can navigate through the pages in the report by either clicking on the pages listed below, or by using the keyword search tool below to find specific information within the annual report.-
 1
1 -
2
-
3
-
4
-
5
-
6
-
7
-
8
-
9
-
10
-
11
-
12
-
13
-
14
-
15
-
16
-
17
-
18
-
19
-
20
-
21
-
22
-
23
-
24
-
25
-
26
-
27
-
28
-
29
-
30
-
31
-
32
-
33
-
34
-
35
-
36
-
37
-
38
-
39
-
40
-
41
-
42
-
43
-
44
-
45
-
46
-
47
-
48
-
49
-
50
-
51
-
52
-
53
-
54
-
55
-
56
-
57
-
58
-
59
-
60
-
61
-
62
-
63
-
64
-
65
-
66
-
67
-
68
-
69
-
70
-
71
-
72
-
73
-
74
-
75
-
76
-
77
-
78
-
79
-
80
-
81
-
82
-
83
-
84
-
85
-
86
-
87
-
88
-
89
-
90
-
 91
91 -
 92
92 -
 93
93 -
 94
94 -
 95
95 -
 96
96 -
 97
97 -
 98
98 -
 99
99 -
 100
100 -
 101
101 -
 102
102 -
 103
103 -
 104
104 -
 105
105 -
 106
106 -
 107
107 -
 108
108 -
 109
109 -
 110
110 -
 111
111 -
112
-
113
-
114
-
115
-
116
-
117
-
118
-
119
-
120
-
121
-
122
-
123
-
124
-
125
-
126
-
127
-
128
-
129
-
130
-
131
-
132
-
133
-
134
-
135
-
136
-
137
-
138
-
139
-
140
-
141
-
142
-
143
-
144
-
145
-
146
-
147
-
148
-
149
-
150
-
151
-
152
-
153
-
154
-
155
-
156
-
157
-
158
-
159
-
160
-
161
-
162
 |
 |

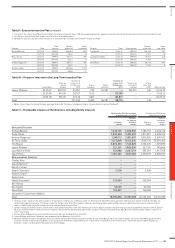
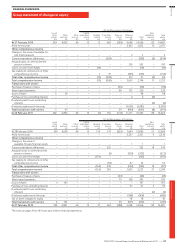
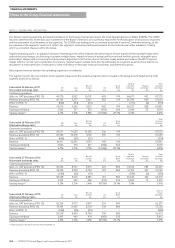
Attributable to owners of the parent
Issued
share
capital
£m
Share
premium
£m
Other
reserves
£m
Capital
redemption
reserve
£m
Hedging
reserve
£m
Translation
reserve
£m
Treasury
shares
£m
Retained
earnings
£m
Total
£m
Non-
controlling
interests
£m
Total
equity
£m
At 27 February 2010 399 4,801 40 13 12 463 (180) 9,048 14,596 85 14,681
Profit for the year – – – – – – – 2,655 2,655 16 2,671
Other comprehensive income
Change in fair value of available-for-
sale financial assets – – – – – – – 2 2 – 2
Currency translation differences – – – – – (339) – – (339) (5) (344)
Actuarial gains on defined benefit
pension schemes – – – – – – – 595 595 – 595
Losses on cash flow hedges – – – – (14) – – – (14) – (14)
Tax relating to components of other
comprehensive income – – – – 1 31 – (185) (153) – (153)
Total other comprehensive income – – – – (13) (308) – 412 91 (5) 86
Total comprehensive income – – – – (13) (308) – 3,067 2,746 11 2,757
Transactions with owners
Purchase of treasury shares – – – – – – (50) – (50) – (50)
Share-based payments – – – – – – 89 131 220 – 220
Issue of shares 3 95 – – – – – – 98 – 98
Purchase of non-controlling interests – – – – – – – 6 6 (6) –
Dividends paid to non-controlling
interests – – – – – – – – – (2) (2)
Dividends authorised in the year – – – – – – – (1,081) (1,081) – (1,081)
Total transactions with owners 3 95 – – – – 39 (944) (807) (8) (815)
At 26 February 2011 402 4,896 40 13 (1) 155 (141) 11,171 16,535 88 16,623
Attributable to owners of the parent
Issued
share
capital
£m
Share
premium
£m
Other
reserves
£m
Capital
redemption
reserve
£m
Hedging
reserve
£m
Translation
reserve
£m
Treasury
shares
£m
Retained
earnings
£m
Total
£m
Non-
controlling
interests
£m
Total
equity
£m
At 28 February 2009 395 4,638 40 13 175 173 (229) 7,644 12,849 57 12,906
Profit for the year – – – – – – – 2,327 2,327 9 2,336
Other comprehensive income
Change in fair value of
available-for-sale financial assets – – – – – – – 1 1 – 1
Currency translation differences – – – – – 325 – – 325 18 343
Actuarial losses on defined benefit
pension schemes – – – – – (2) (320) (322) – (322)
Losses on cash flow hedges – – – – (163) – – – (163) – (163)
Tax relating to components of other
comprehensive income – – – – – (33) – 87 54 – 54
Total other comprehensive income – – – – (163) 290 – (232) (105) 18 (87)
Total comprehensive income – – – – (163) 290 – 2,095 2,222 27 2,249
Transactions with owners
Purchase of treasury shares – – – – – – (24) – (24) – (24)
Share-based payments – – – – – – 73 168 241 – 241
Issue of shares 4 163 – – – – – – 167 – 167
Purchase of non-controlling interests – – – – – – – 91 91 3 94
Dividends paid to non-controlling
interests – – – – – – – – – (2) (2)
Dividends authorised in the year – – – – – – – (968) (968) – (968)
Tax on items charged to equity – – – – – – – 18 18 – 18
Total transactions with owners 4 163 – – – – 49 (691) (475) 1 (474)
At 27 February 2010 399 4,801 40 13 12 463 (180) 9,048 14,596 85 14,681
The notes on pages 99 to 145 form part of these financial statements.
TESCO PLC Annual Report and Financial Statements 2011
—
97
Overview Business review Governance Financial statements
FINANCIAL STATEMENTS
Group statement of changes in equity