SunTrust 2005 Annual Report Download - page 58
Download and view the complete annual report
Please find page 58 of the 2005 SunTrust annual report below. You can navigate through the pages in the report by either clicking on the pages listed below, or by using the keyword search tool below to find specific information within the annual report.-
 1
1 -
2
-
3
-
4
-
5
-
6
-
7
-
8
-
9
-
10
-
11
-
12
-
13
-
14
-
15
-
16
-
17
-
18
-
19
-
20
-
21
-
22
-
23
-
24
-
25
-
26
-
27
-
28
-
29
-
30
-
31
-
32
-
33
-
34
-
35
-
36
-
37
-
38
-
39
-
40
-
41
-
42
-
43
-
44
-
45
-
46
-
47
-
 48
48 -
 49
49 -
 50
50 -
 51
51 -
 52
52 -
 53
53 -
 54
54 -
 55
55 -
 56
56 -
 57
57 -
 58
58 -
 59
59 -
 60
60 -
 61
61 -
 62
62 -
 63
63 -
 64
64 -
 65
65 -
 66
66 -
 67
67 -
 68
68 -
69
-
70
-
71
-
72
-
73
-
74
-
75
-
76
-
77
-
78
-
79
-
80
-
81
-
82
-
83
-
84
-
85
-
86
-
87
-
88
-
89
-
90
-
91
-
92
-
93
-
94
-
95
-
96
-
97
-
98
-
99
-
100
-
101
-
102
-
103
-
104
-
105
-
106
-
107
-
108
-
109
-
110
-
111
-
112
-
113
-
114
-
115
-
116
 |
 |

SUNTRUST ANNUAL REPORT56
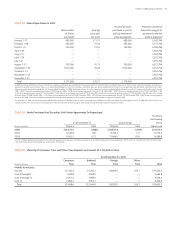
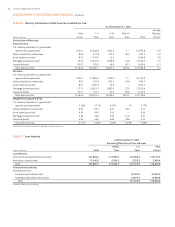
TABLE • Maturity Distribution of Debt Securities Available for Sale
As of December ,
Average
Year – – After Maturity
(Dollars in millions) or Less Years Years Years Total in Years
Distribution of Maturities:
Amortized Cost
U.S. Treasury and other U.S. government
agencies and corporations . ,. . — ,. .
States and political subdivisions . . . . . .
Asset-backed securities . ,. . — ,. .
Mortgage-backed securities . ,. ,. . ,. .
Corporate bonds . . . . ,. .
Total debt securities ,. ,. ,. . ,. .
Fair Value
U.S. Treasury and other U.S. government
agencies and corporations . ,. . — ,.
States and political subdivisions . . . . .
Asset-backed securities . ,. . — ,.
Mortgage-backed securities . ,. ,. . ,.
Corporate bonds . . . . ,.
Total debt securities ,. ,. ,. . ,.
Weighted average yield (FTE):
U.S. Treasury and other U.S. government
agencies and corporations .% .% .% —% .%
States and political subdivisions . . . . .
Asset-backed securities . . . — .
Mortgage-backed securities . . . . .
Corporate bonds . . . . .
Total debt securities .% .% .% .% .%
Distribution of maturities is based on the expected average life of the asset.
TABLE • Loan Maturity
As of December ,
Remaining Maturities of Selected Loans
Within – After
(Dollars in millions) Total Year Years Years
Loan Maturity
Commercial and commercial real estate ,. ,. ,. ,.
Real estate – construction ,. ,. ,. ,.
Total ,. ,. ,. ,.
Interest Rate Sensitivity
Selected loans with:
Predetermined interest rates ,. ,.
Floating or adjustable interest rates ,. ,.
Total ,. ,.
Excludes . billion in lease financing.
MANAGEMENT’S DISCUSSION AND ANALYSIS continued