SunTrust 2005 Annual Report Download - page 30
Download and view the complete annual report
Please find page 30 of the 2005 SunTrust annual report below. You can navigate through the pages in the report by either clicking on the pages listed below, or by using the keyword search tool below to find specific information within the annual report.-
 1
1 -
2
-
3
-
4
-
5
-
6
-
7
-
8
-
9
-
10
-
11
-
12
-
13
-
14
-
15
-
16
-
17
-
18
-
19
-
 20
20 -
 21
21 -
 22
22 -
 23
23 -
 24
24 -
 25
25 -
 26
26 -
 27
27 -
 28
28 -
 29
29 -
 30
30 -
 31
31 -
 32
32 -
 33
33 -
 34
34 -
 35
35 -
 36
36 -
 37
37 -
 38
38 -
 39
39 -
 40
40 -
41
-
42
-
43
-
44
-
45
-
46
-
47
-
48
-
49
-
50
-
51
-
52
-
53
-
54
-
55
-
56
-
57
-
58
-
59
-
60
-
61
-
62
-
63
-
64
-
65
-
66
-
67
-
68
-
69
-
70
-
71
-
72
-
73
-
74
-
75
-
76
-
77
-
78
-
79
-
80
-
81
-
82
-
83
-
84
-
85
-
86
-
87
-
88
-
89
-
90
-
91
-
92
-
93
-
94
-
95
-
96
-
97
-
98
-
99
-
100
-
101
-
102
-
103
-
104
-
105
-
106
-
107
-
108
-
109
-
110
-
111
-
112
-
113
-
114
-
115
-
116
 |
 |

SUNTRUST ANNUAL REPORT28
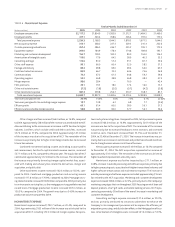
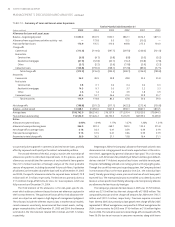
primarily due to recording a full year of amortization for NCF intangible
assets (primarily core deposit intangible) versus only one quarter of amor-
tization in .
The Company incurred merger expense totaling . million, com-
pared to . million as of December , . These charges represented
costs to integrate the operations of NCF and consist primarily of consulting
fees for systems and other integration initiatives, employee-related charges
and marketing expenditures. Effective April , , substantially all of
the systems of National Bank of Commerce were converted to SunTrust’s
systems. As of December , , the Company has recognized all merger
expense related to the NCF integration process. The total merger expense
for the NCF integration was . million, slightly above the Company’s
original estimate of million.
Other noninterest expense increased . million, or .%, com-
pared to . The increase was primarily due to impairment charges for
certain affordable housing properties, which are evaluated on a quarterly
basis for impairment. In addition, management evaluated its strategic
intent in this business, and determined in the third quarter of that the
Company would likely pursue selling some of its holdings. SunTrust esti-
mated the fair value of these properties using a market valuation based on
the properties’ estimated future cash flows, debt structures, and tax credits,
along with the proposed sales price. This analysis indicated that the carry-
ing value of some of the properties exceeded the estimated fair value. For
the twelve months ended December , , these charges totaled .
million, compared to . million for the same period last year.
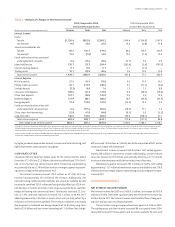
The efficiency ratio improved to .% in compared to .%
in . The efficiency ratio excluding merger expense was .% in
compared to .% in .
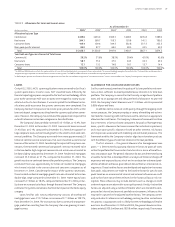
PROVISION FOR INCOME TAXES
The provision for income taxes includes both federal and state income
taxes. In , the provision was . million, compared to . mil-
lion in . The provision represents an effective tax rate of .% for
compared to .% for .
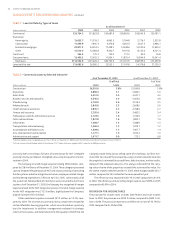
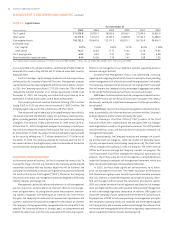
TABLE • Loan Portfolio by Types of Loans
As of December
(Dollars in millions)
Commercial ,. ,. ,. ,. ,. ,.
Real estate:
Home equity ,. ,. ,. ,. ,. ,.
Construction ,. ,. ,. ,. ,. ,.
Residential mortgages ,. ,. ,. ,. ,. ,.
Other ,. ,. ,. ,. ,. ,.
Credit card . . . . . .
Consumer loans ,. ,. ,. ,. ,. ,.
Total loans ,. ,. ,. ,. ,. ,.
Loans held for sale ,. ,. ,. ,. ,. ,.
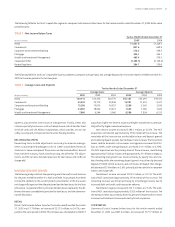
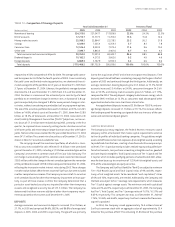
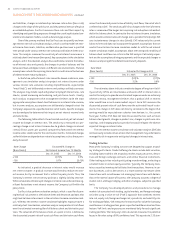
TABLE • Commercial Loans by Selected Industries
As of December , As of December ,
% of Total % of Total
(Dollars in millions) Loans Loans Loans Loans
Construction ,. .% ,. .%
Real estate ,. . ,. .
Retail trade ,. . ,. .
Business services and nonprofits ,. . ,. .
Manufacturing ,. . ,. .
Wholesale trade ,. . ,. .
Health and social assistance ,. . ,. .
Finance and insurance ,. . ,. .
Professional, scientific and technical services ,. . ,. .
Public administration ,. . ,. .
Information ,. . ,. .
Transportation and warehousing ,. . ,. .
Accomodation and food services ,. . ,. .
Arts, entertainment and recreation ,. . ,. .
Administrative and support ,. . . .
Industry groupings are loans in aggregate greater than billion as of December , based on the North American Industry Classification System (“NAICS”).
NCF loan systems utilized Standard Industrial Classificiation (“SIC”) codes, which were mapped to NAICS codes for the presentation.
MANAGEMENT’S DISCUSSION AND ANALYSIS continued