SunTrust 2005 Annual Report Download - page 24
Download and view the complete annual report
Please find page 24 of the 2005 SunTrust annual report below. You can navigate through the pages in the report by either clicking on the pages listed below, or by using the keyword search tool below to find specific information within the annual report.-
 1
1 -
2
-
3
-
4
-
5
-
6
-
7
-
8
-
9
-
10
-
11
-
12
-
13
-
 14
14 -
 15
15 -
 16
16 -
 17
17 -
 18
18 -
 19
19 -
 20
20 -
 21
21 -
 22
22 -
 23
23 -
 24
24 -
 25
25 -
 26
26 -
 27
27 -
 28
28 -
 29
29 -
 30
30 -
 31
31 -
 32
32 -
 33
33 -
 34
34 -
35
-
36
-
37
-
38
-
39
-
40
-
41
-
42
-
43
-
44
-
45
-
46
-
47
-
48
-
49
-
50
-
51
-
52
-
53
-
54
-
55
-
56
-
57
-
58
-
59
-
60
-
61
-
62
-
63
-
64
-
65
-
66
-
67
-
68
-
69
-
70
-
71
-
72
-
73
-
74
-
75
-
76
-
77
-
78
-
79
-
80
-
81
-
82
-
83
-
84
-
85
-
86
-
87
-
88
-
89
-
90
-
91
-
92
-
93
-
94
-
95
-
96
-
97
-
98
-
99
-
100
-
101
-
102
-
103
-
104
-
105
-
106
-
107
-
108
-
109
-
110
-
111
-
112
-
113
-
114
-
115
-
116
 |
 |
SUNTRUST ANNUAL REPORT22
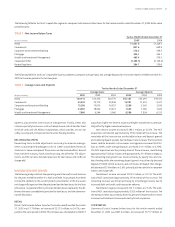
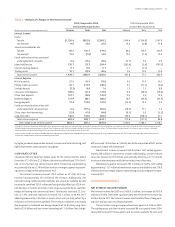
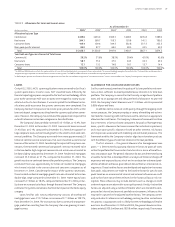
.%, compared to the same period in . NCF accounted for approxi-
mately million of the increase. The remaining increase was due to
improvement in net interest income and higher noninterest income, par-
tially offset by higher noninterest expense.
Net interest income increased . million, or .%. Net interest
income growth was driven by loan and deposit growth and higher deposit
spreads. Average loans increased . billion, or .%, and average depos-
its increased . billion, or .%. NCF accounted for approximately
million of the net interest income growth, approximately billion
of the loan growth and approximately billion of the deposit growth. The
remaining loan growth was driven by stronger demand for commercial loans
and commercial real estate. The remaining deposit growth was attributable
to increased client liquidity. Net charge-offs were flat when compared to
the same period in , despite approximately a million increase from
NCF and a . million increase from AHG.
Noninterest income increased . million, or .%. NCF
accounted for approximately million of the increase. AHG contributed
. million of the increase, driven by higher tax credits from new proper-
ties and investments, as well as higher partnership revenue. Also contribut-
ing to the increase were internal cross line of business sales credits, loan
fees, and deposit sweep income. Partially offsetting these increases, service
charges on deposits decreased . million, or .%, driven by higher
compensating balances and increased client earnings credit rates.
Noninterest expense increased . million, or .%. NCF
accounted for approximately million of the increase. An additional
. million of the increase was attributable to AHG activities, primarily
impairment and other charges related to affordable housing properties.
The remaining increase was primarily in salaries and performance based
incentives.
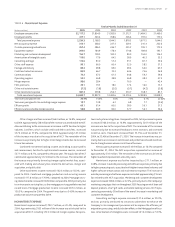
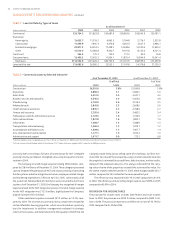
CORPORATE AND INVESTMENT BANKING
CIB’s total income before taxes for the twelve months ended December
, was . million, an increase of . million, or .%, com-
pared to the same period in . Improvements in net interest income and
investment banking income drove the increase.
Net interest income increased . million, or .%. Average loans
increased . billion, or .%, and average deposits increased . mil-
lion, or .%. Core commercial loan and lease growth was due to increased
corporate demand and increased merger and acquisition activity. Net
charge-offs decreased . million, or .%.
Noninterest income increased . million, or .%, driven by
increased trading and advisory fees in investment grade bond issuances,
merger and acquisition, leasing, and fixed income/equity derivatives. This
was partially offset by reduced activity in equity offerings, securitization,
and credit trading.
Noninterest expense decreased . million, or .%. This decrease
was driven by a . million decline in other expenses primarily due to
lower leveraged lease expense. This was partially offset by increased per-
sonnel expense of . million due to higher variable compensation asso-
ciated with increased fee income.
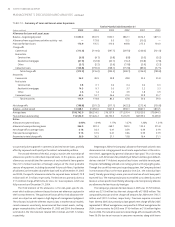
MORTGAGE
Mortgage’s total income before taxes for the twelve months ended
December , was . million, an increase of . million, or
.%, compared to the same period in . Income from record loan
production, net interest income from loan growth, and higher fees drove
the increase. This was partially offset by higher volume and growth-related
expenses.
Net interest income increased . million, or .%. Average loans,
principally residential mortgage loans, increased . billion, or .%.
Loan related net interest income increased . million, or .%, due
to the higher volumes at compressed spreads. Average deposits increased
. million, or .%, contributing . million to net interest income,
an increase of . million. Average mortgage loans held for sale were up
. billion. However, rising short-term interest rates drove compressed
spreads, resulting in a decline in net interest income of . million.
Higher internal funding costs for other assets, principally goodwill, reduced
net interest income . million. Net charge-offs increased . million.
Noninterest income increased . million, or .%, primarily
due to higher loan origination and servicing income. Record production
of . billion, higher loan sales, and the addition of NCF resulted in an
increase in loan production income of . million. Servicing income
was up . million primarily due to higher servicing fees, and to a lesser
degree, a decline in mortgage servicing rights (“MSRs”) amortization. As of
December , , the servicing portfolio was . billion compared to
. billion at December , . Other noninterest income increased
. million principally due to volume-related fees.
Noninterest expense increased . million, or .%, due to
higher personnel expense and other volume and growth related expenses.
The higher personnel expense resulted from growth in the sales force,
higher volume-related commissions, and higher benefit costs.
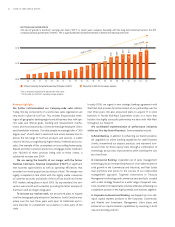
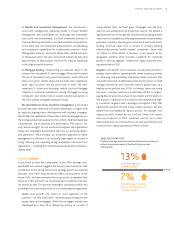
WEALTH AND INVESTMENT MANAGEMENT
Wealth and Investment Management’s total income before taxes for the
twelve months ended December , was . million, an increase
of . million, or .%, compared to the same period in . NCF
represented approximately million of the increase while Seix and ZCI
represented approximately million of the increase. The remainder of the
growth was primarily driven by increased net interest income and noninter-
est income, partially offset by higher personnel expense and amortization
of intangibles.
Net interest income increased . million, or .%. NCF con-
tributed approximately million. Average loans increased . billion, or
.%, including approximately million attributable to NCF. Average
deposits increased . billion, or .%, including million attribut-
able to NCF. Net charge-offs increased . million, primarily due to NCF.
Noninterest income increased . million, or .%. NCF
accounted for approximately million of the increase while Seix and
ZCI accounted for approximately million. Assets under management
increased approximately . billion, or .%, due to new business and an
increase in equity markets. As of December , , assets under manage-
ment were approximately . billion compared to . billion as of
December , . Assets under management include individually man-
aged assets, the STI Classic Funds, institutional assets managed by Trusco,
and participant-directed retirement accounts. SunTrust’s total assets under
advisement were approximately . billion, which include the afore-
mentioned assets under management, . billion in non-managed trust
assets, . billion in retail brokerage assets, and . billion in non-
managed corporate trust assets.
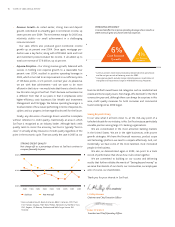
Noninterest expense increased . million, or .%. NCF con-
tributed approximately million of the increase and Seix and ZCI con-
tributed approximately million. The balance of the increase was driven
MANAGEMENT’S DISCUSSION AND ANALYSIS continued