SunTrust 2005 Annual Report Download - page 32
Download and view the complete annual report
Please find page 32 of the 2005 SunTrust annual report below. You can navigate through the pages in the report by either clicking on the pages listed below, or by using the keyword search tool below to find specific information within the annual report.-
 1
1 -
2
-
3
-
4
-
5
-
6
-
7
-
8
-
9
-
10
-
11
-
12
-
13
-
14
-
15
-
16
-
17
-
18
-
19
-
20
-
21
-
 22
22 -
 23
23 -
 24
24 -
 25
25 -
 26
26 -
 27
27 -
 28
28 -
 29
29 -
 30
30 -
 31
31 -
 32
32 -
 33
33 -
 34
34 -
 35
35 -
 36
36 -
 37
37 -
 38
38 -
 39
39 -
 40
40 -
 41
41 -
 42
42 -
43
-
44
-
45
-
46
-
47
-
48
-
49
-
50
-
51
-
52
-
53
-
54
-
55
-
56
-
57
-
58
-
59
-
60
-
61
-
62
-
63
-
64
-
65
-
66
-
67
-
68
-
69
-
70
-
71
-
72
-
73
-
74
-
75
-
76
-
77
-
78
-
79
-
80
-
81
-
82
-
83
-
84
-
85
-
86
-
87
-
88
-
89
-
90
-
91
-
92
-
93
-
94
-
95
-
96
-
97
-
98
-
99
-
100
-
101
-
102
-
103
-
104
-
105
-
106
-
107
-
108
-
109
-
110
-
111
-
112
-
113
-
114
-
115
-
116
 |
 |

SUNTRUST ANNUAL REPORT30
was primarily due to growth in commercial and real estate loans, partially
offset by improved credit quality in the indirect automobile portfolio.
The second element of the ALLL analysis involves the estimation of
allowances specific to individual impaired loans. In this process, specific
allowances are established for commercial and residential loans greater
than . million based on a thorough analysis of the most probable
sources of repayment, including discounted future cash flows, liquidation
of collateral, or the market value of the loan itself. As of December ,
and , the specific allowance related to impaired loans totaled .
million and . million, respectively. The decline was primarily due to a
. million charge-off of Delta Air Lines, Inc. lease exposure, which was
fully reserved as of December , .
The third element of the allowance is the non-pool-specific ele-
ment which addresses inherent losses that are not otherwise captured in
the first two elements. The qualitative factors of this third allowance ele-
ment are subjective and require a high degree of management judgment.
These factors include the inherent imprecisions in mathematical models,
recent economic uncertainty, losses incurred from recent events, and lag-
ging or incomplete data. As of December , and , the allowance
estimated in the third element totaled . million and . million,
respectively.
Beginning in , the Company’s allowance framework utilized a two
dimensional risk rating approach to estimate expected loss at the instru-
ment level, aggregated by general allowance loan pool. This risk rating
structure, with dimensions for probability of default and loss given default,
derives a total of distinct expected loss factors available to each pool.
The prior methodology utilized a risk rating system with only eight grades.
Through the use of this more precise grading system, the Company derived
its estimation of loss to the most granular level (i.e., the individual loan
level), thereby generating a more precise estimation of each loan pool’s
expected loss. The more granular process enabled us to identify incurred
losses at a more specific level thereby allowing us to more precisely allocate
our allowance for loan losses by loan type.
The Company’s provision for loan losses in was . million,
which was . million less than net charge-offs of . million. The
comparable provision and net charge-off amounts for were .
million and . million, respectively. Provision expense increased
from to due primarily to loan growth. Net charge-offs for
represented .% of average loans, compared to .% of average loans for
. Loan recoveries for were . million, or . million higher
than in . The ratio of recoveries to total charge-offs increased to .%
from .% due to an increase in consumer recoveries along with lower
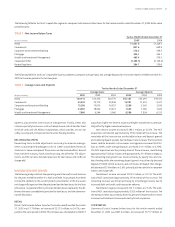
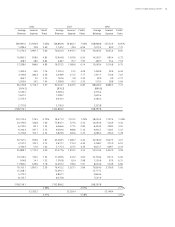
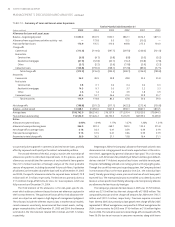
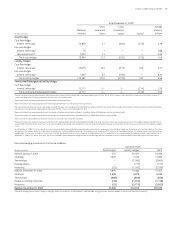
TABLE • Summary of Loan and Lease Losses Experience
Twelve Months Ended December
(Dollars in millions)
Allowance for Loan and Lease Losses
Balance – beginning of period ,. . . . . .
Allowance from acquisitions and other activity – net — . . . (.) —
Provision for loan losses . . . . . .
Charge-offs
Commercial (.) (.) (.) (.) (.) (.)
Real estate:
Construction (.) (.) (.) (.) (.) (.)
Residential mortgages (.) (.) (.) (.) (.) (.)
Other (.) (.) (.) (.) (.) (.)
Consumer loans (.) (.) (.) (.) (.) (.)
Total charge-offs (.) (.) (.) (.) (.) (.)
Recoveries
Commercial . . . . . .
Real estate:
Construction . . . . . .
Residential mortgages . . . . . .
Other . . . . . .
Consumer loans . . . . . .
Total recoveries . . . . . .
Net charge-offs (.) (.) (.) (.) (.) (.)
Balance – end of period ,. ,. . . . .
Average loans ,. ,. ,. ,. ,. ,.
Year end loans outstanding ,. ,. ,. ,. ,. ,.
Ratios:
Allowance to year end loans .% .% .% .% .% .%
Allowance to nonperforming loans . . . . . .
Net charge-offs to average loans . . . . . .
Provision to average loans . . . . . .
Recoveries to total charge-offs . . . . . .
MANAGEMENT’S DISCUSSION AND ANALYSIS continued