SunTrust 2005 Annual Report Download - page 29
Download and view the complete annual report
Please find page 29 of the 2005 SunTrust annual report below. You can navigate through the pages in the report by either clicking on the pages listed below, or by using the keyword search tool below to find specific information within the annual report.-
 1
1 -
2
-
3
-
4
-
5
-
6
-
7
-
8
-
9
-
10
-
11
-
12
-
13
-
14
-
15
-
16
-
17
-
18
-
 19
19 -
 20
20 -
 21
21 -
 22
22 -
 23
23 -
 24
24 -
 25
25 -
 26
26 -
 27
27 -
 28
28 -
 29
29 -
 30
30 -
 31
31 -
 32
32 -
 33
33 -
 34
34 -
 35
35 -
 36
36 -
 37
37 -
 38
38 -
 39
39 -
40
-
41
-
42
-
43
-
44
-
45
-
46
-
47
-
48
-
49
-
50
-
51
-
52
-
53
-
54
-
55
-
56
-
57
-
58
-
59
-
60
-
61
-
62
-
63
-
64
-
65
-
66
-
67
-
68
-
69
-
70
-
71
-
72
-
73
-
74
-
75
-
76
-
77
-
78
-
79
-
80
-
81
-
82
-
83
-
84
-
85
-
86
-
87
-
88
-
89
-
90
-
91
-
92
-
93
-
94
-
95
-
96
-
97
-
98
-
99
-
100
-
101
-
102
-
103
-
104
-
105
-
106
-
107
-
108
-
109
-
110
-
111
-
112
-
113
-
114
-
115
-
116
 |
 |

SUNTRUST ANNUAL REPORT 27
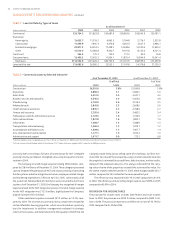
Other charges and fees increased . million, or .%, compared
to . Approximately million of the increase was attributable to NCF.
Also contributing to the increase was an increase in ATM fees due to higher
volumes. Card fees, which include credit and debit cards fees, increased
. million, or .%, compared to . Approximately million
of the increase was due to the acquisition of NCF. The remainder of the
increase was primarily due to higher interchange income due to increased
transaction volume.
Combined investment banking income and trading account profits
and commissions, SunTrust’s capital markets revenue sources, increased
. million, or .%, compared to the prior year. The acquisition of NCF
contributed approximately million to the increase. The remainder of
the increase was primarily driven by stronger capital market fees, associ-
ated with trading and advisory fees related to derivatives, merger and
acquisition, and public debt.
Other noninterest income increased . million, or .%, com-
pared to . Combined mortgage production and servicing income
increased . million, or .%, compared to . Mortgage servic-
ing related income increased . million compared to primarily due
to an increase in servicing fees, as the mortgage servicing portfolio reached
record levels. Mortgage production income increased . million, or
.%, compared to . The growth was due to a .% increase in
production volume compared to .
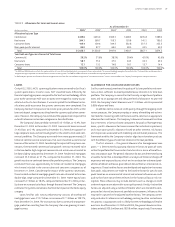
NONINTEREST EXPENSE
Noninterest expense increased . million, or .%, compared to
. Approximately million of the increase was attributed to the
acquisition of NCF, including . million of merger expense for opera-
tions and systems integration. Compared to , total personnel expense
increased . million, or .%. Approximately million of the
increase was due to the acquisition of NCF. The remainder of the increase
was primarily due to increased headcount, merit increases, and increased
incentive costs. Headcount increased from , as of December ,
, to , at December , . The increase in incentives was pri-
marily due to an increase in commission and performance based incentives
due to strong business volumes in all lines of business.
Net occupancy expense increased . million, or .% compared
to December , . The NCF acquisition represented an increase of
approximately million. The remainder of the increase was driven by
higher leasehold improvement and utility costs.
Noninterest expense was further impacted by a . million, or
.%, increase in outside processing and software expenses primarily due
to higher processing costs associated with higher transactional volumes and
higher software amortization and maintenance expense. The increase in
outside processing and software expenses included approximately mil-
lion related to the NCF acquisition. Marketing and customer development
expense increased . million, or .%, primarily due to the Company’s
marketing campaigns that ran throughout focusing on retail loan and
deposit products, Visa® gift cards, and online banking services. NCF repre-
sented approximately million of the overall increase in marketing and
customer development.
Consulting and legal expense increased . million, or .%,
and was primarily attributed to initiatives undertaken to enhance the
Company’s risk management processes and to improve the efficiency of
origination, processing, and distribution efforts in the Mortgage line of busi-
ness. Amortization of intangible assets increased . million, or .%,
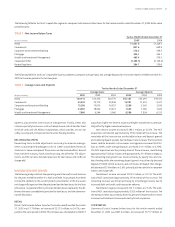
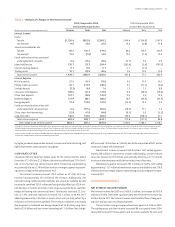
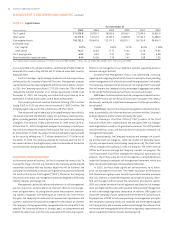
TABLE • Noninterest Expense
Twelve Months Ended December
(Dollars in millions)
Employee compensation ,. ,. ,. ,. ,. ,.
Employee benefits . . . . . .
Total personnel expense ,. ,. ,. ,. ,. ,.
Net occupancy expense . . . . . .
Outside processing and software . . . . . .
Equipment expense . . . . . .
Marketing and customer development . . . . . .
Amortization of intangible assets . . . . . .
Consulting and legal . . . . . .
Other staff expense . . . . . .
Postage and delivery . . . . . .
Credit and collection services . . . . . .
Communications . . . . . .
Operating supplies . . . . . .
Merger expense . . — . — .
FDIC premiums . . . . . .
Other real estate income (.) (.) (.) (.) (.) (.)
Other noninterest expense . . . . . .
Total noninterest expense ,. ,. ,. ,. ,. ,.
Year-over-year growth rate .% .% .% .% .% (.)%
Year-over-year growth rate excluding merger expense . . . . . (.)
Efficiency ratio . . . . . .
Efficiency ratio excluding merger expense . . . . . .