SunTrust 2005 Annual Report Download - page 23
Download and view the complete annual report
Please find page 23 of the 2005 SunTrust annual report below. You can navigate through the pages in the report by either clicking on the pages listed below, or by using the keyword search tool below to find specific information within the annual report.-
 1
1 -
2
-
3
-
4
-
5
-
6
-
7
-
8
-
9
-
10
-
11
-
12
-
 13
13 -
 14
14 -
 15
15 -
 16
16 -
 17
17 -
 18
18 -
 19
19 -
 20
20 -
 21
21 -
 22
22 -
 23
23 -
 24
24 -
 25
25 -
 26
26 -
 27
27 -
 28
28 -
 29
29 -
 30
30 -
 31
31 -
 32
32 -
 33
33 -
34
-
35
-
36
-
37
-
38
-
39
-
40
-
41
-
42
-
43
-
44
-
45
-
46
-
47
-
48
-
49
-
50
-
51
-
52
-
53
-
54
-
55
-
56
-
57
-
58
-
59
-
60
-
61
-
62
-
63
-
64
-
65
-
66
-
67
-
68
-
69
-
70
-
71
-
72
-
73
-
74
-
75
-
76
-
77
-
78
-
79
-
80
-
81
-
82
-
83
-
84
-
85
-
86
-
87
-
88
-
89
-
90
-
91
-
92
-
93
-
94
-
95
-
96
-
97
-
98
-
99
-
100
-
101
-
102
-
103
-
104
-
105
-
106
-
107
-
108
-
109
-
110
-
111
-
112
-
113
-
114
-
115
-
116
 |
 |

SUNTRUST ANNUAL REPORT 21
opment, procurement, and executive management. Finally, Other also
includes specialty businesses such as Transplatinum, which handles Fleet
One fuel cards and USI Alliance Corporation, which provides services for
safety, security and crime prevention to senior housing facilities.
RECONCILING ITEMS
Reconciling items include adjustments necessary to reconcile manage-
ment accounting methodologies with US GAAP consolidated financial
statements. Some examples of these items are the residual offsets derived
from matched-maturity funds transfer pricing, the offset for FTE adjust-
ments, and the variance between provision for loan losses and LOBs net
charge-offs.
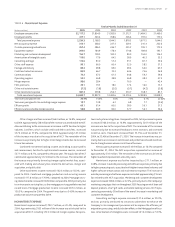
BUSINESS SEGMENT RESULTS
The following analysis details the operating results for each line of business
for the years ended December , and . Prior periods have been
restated to conform to the current period’s presentation. In the discussion
net charge-offs represent the allocated provision for loan losses for the lines
of business. Corporate/Other’s provision for loan losses represents the dif-
ference between consolidated provision for loan losses and the aforemen-
tioned allocations.
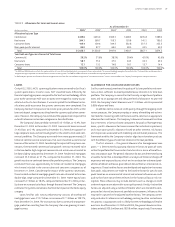
RETAIL
Retail’s total income before taxes for the twelve months ended December
, was . billion, an increase of . million, or .%, com-
pared to the same period in . This increase was attributable to the NCF
acquisition, higher net interest income and higher noninterest income par-
tially offset by higher noninterest expense.
Net interest income increased . million, or .%. The NCF
acquisition contributed approximately million of the increase. The
remainder of the increase was attributable to loan and deposit growth
and widening deposit spreads due to deposit rate increases that have been
slower relative to market rate increases. Average loans increased . bil-
lion, or .%, while average deposits increased . billion, or .%.
The NCF acquisition was the primary driver of these increases, contributing
approximately billion in loans and approximately billion in deposits.
The remaining loan growth was driven primarily by equity lines and stu-
dent lending while the remaining deposit growth was driven by demand
deposits (“DDA”), NOW accounts, and certificates of deposit. Net charge-
offs decreased . million, or .%, primarily due to a decline in consumer
indirect net charge-offs.
Noninterest income increased . million, or .%. The addi-
tion of NCF contributed approximately million of this increase. The
remaining increase was driven primarily by interchange income due to
increased debit and credit card transaction volumes.
Noninterest expense increased . million, or .%. The addi-
tion of NCF contributed approximately million of the increase. The
remaining increase was primarily driven by personnel expense due to merit
increases and headcount increases driven by branch expansion.
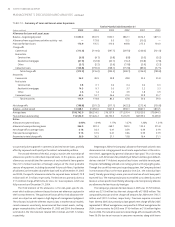
COMMERCIAL
Commercial’s total income before taxes for the twelve months ended
December , was . million, an increase of . million, or
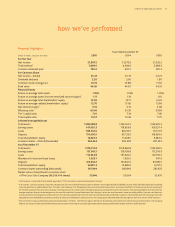
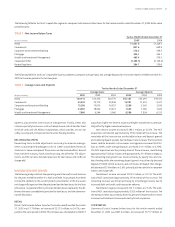
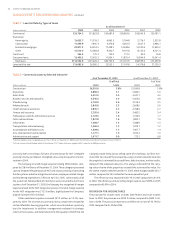
The following table for SunTrust’s reportable segments compares total income before taxes for the twelve months ended December , to the same
period last year:
TABLE • Net Income Before Taxes
Twelve Months Ended December
(Dollars in millions)
Retail ,. ,.
Commercial . .
Corporate and Investment Banking . .
Mortgage . .
Wealth and Investment Management . .
Corporate/Other (,.) (,.)
Reconciling Items . .
The following table for SunTrust’s reportable business segments compares average loans and average deposits for the twelve months ended December ,
to the same period in the last two years:
TABLE • Average Loans and Deposits
Twelve Months Ended December
Average loans Average deposits
(Dollars in millions)
Retail , , , , , ,
Commercial , , , , , ,
Corporate and Investment Banking , , , , , ,
Mortgage , , , , , ,
Wealth and Investment Management , , , , , ,