SunTrust 2005 Annual Report Download - page 13
Download and view the complete annual report
Please find page 13 of the 2005 SunTrust annual report below. You can navigate through the pages in the report by either clicking on the pages listed below, or by using the keyword search tool below to find specific information within the annual report.-
 1
1 -
2
-
 3
3 -
 4
4 -
 5
5 -
 6
6 -
 7
7 -
 8
8 -
 9
9 -
 10
10 -
 11
11 -
 12
12 -
 13
13 -
 14
14 -
 15
15 -
 16
16 -
 17
17 -
 18
18 -
 19
19 -
 20
20 -
 21
21 -
 22
22 -
 23
23 -
24
-
25
-
26
-
27
-
28
-
29
-
30
-
31
-
32
-
33
-
34
-
35
-
36
-
37
-
38
-
39
-
40
-
41
-
42
-
43
-
44
-
45
-
46
-
47
-
48
-
49
-
50
-
51
-
52
-
53
-
54
-
55
-
56
-
57
-
58
-
59
-
60
-
61
-
62
-
63
-
64
-
65
-
66
-
67
-
68
-
69
-
70
-
71
-
72
-
73
-
74
-
75
-
76
-
77
-
78
-
79
-
80
-
81
-
82
-
83
-
84
-
85
-
86
-
87
-
88
-
89
-
90
-
91
-
92
-
93
-
94
-
95
-
96
-
97
-
98
-
99
-
100
-
101
-
102
-
103
-
104
-
105
-
106
-
107
-
108
-
109
-
110
-
111
-
112
-
113
-
114
-
115
-
116
 |
 |

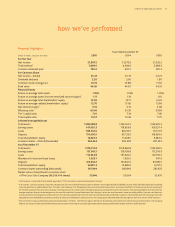
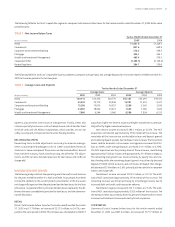
Financial Highlights
Year Ended December 31
(Dollars in millions, except per share data) 2005 2004 2003
For the Year
Net income $1,987.2 $1,572.9 $1,332.3
Total revenue17,809.5 6,348.0 5,668.3
Common dividends paid 795.0 603.3 505.4
Per Common Share
Net income – diluted $5.47 $ 5.19 $4.73
Dividends declared 2.20 2.00 1.80
Common stock closing price 72.76 73.88 71.50
Book value 46.65 44.30 34.52
Financial Ratios
Return on average total assets 1.18% 1.18% 1.09%
Return on average assets less net unrealized securities gains21.17 1.19 1.01
Return on average total shareholders’ equity 12.02 13.71 14.67
Return on average realized shareholders’ equity212.70 15.65 15.98
Net interest margin33.16 3.15 3.08
Efficiency ratio360.06 61.39 59.99
Tier 1 capital ratio 7.01 7.16 7.85
Total capital ratio 10.57 10.36 11.75
Selected Average Balances
Total assets $168,088.8 $133,754.3 $122,325.4
Earning assets 147,435.3 118,905.6 109,257.4
Loans 108,742.0 86,214.5 76,137.9
Deposits 110,406.5 87,132.9 80,039.0
Total shareholders’ equity 16,526.3 11,469.5 9,083.0
Common shares – diluted (thousands) 363,454 303,309 281,434
As of December 31
Total assets $179,712.8 $158,869.8 $125,250.5
Earning assets 157,661.5 138,726.6 112,376.9
Loans 114,554.9 101,426.2 80,732.3
Allowance for loan and lease losses 1,028.1 1,050.0 941.9
Deposits 122,053.2 103,361.3 81,189.5
Total shareholders’ equity 16,887.4 15,986.9 9,731.2
Common shares outstanding (thousands) 361,984 360,840 281,923
Market value of investment in common stock
of The Coca-Cola Company (48,266,496 shares) $1,946 $2,004 $2,450
1Total revenue is comprised of fully taxable-equivalent (“FTE”) net interest income and noninterest income.
2In this report, SunTrust presents a return on average assets less net unrealized securities gains and return on average realized shareholders’ equity which exclude realized and unrealized
securities gains/losses and dividends from The Coca-Cola Company. The foregoing numbers primarily reflect adjustments to remove the effects of the ownership by the Company of
48.3 million shares of The Coca-Cola Company. The Company uses this information internally to gauge its actual performance in the industry. The Company believes that the return on
average assets less the net unrealized gains on the securities portfolio is more indicative of the Company’s return on assets because it more accurately reflects the return on the assets
that are related to the Company’s core businesses. The Company also believes that the return on average realized shareholders’ equity is more indicative of the Company’s return on
equity because the excluded equity relates primarily to a long term holding of a specific security. The Company provides reconcilements on pages 53 and 54 for all non-GAAP measures.
3The net interest margin and efficiency ratios are presented on a FTE basis. The FTE basis adjusts for the tax-favored status of income from certain loans and investments. The Company
believes this measure to be the preferred industry measurement of net interest income and provides relative comparison between taxable and non-taxable amounts.
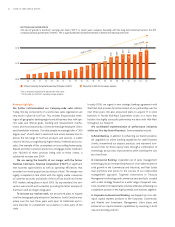
how we’ve performed
SUNTRUST 2005 ANNUAL REPORT 11