SunTrust 2005 Annual Report Download - page 45
Download and view the complete annual report
Please find page 45 of the 2005 SunTrust annual report below. You can navigate through the pages in the report by either clicking on the pages listed below, or by using the keyword search tool below to find specific information within the annual report.-
 1
1 -
2
-
3
-
4
-
5
-
6
-
7
-
8
-
9
-
10
-
11
-
12
-
13
-
14
-
15
-
16
-
17
-
18
-
19
-
20
-
21
-
22
-
23
-
24
-
25
-
26
-
27
-
28
-
29
-
30
-
31
-
32
-
33
-
34
-
 35
35 -
 36
36 -
 37
37 -
 38
38 -
 39
39 -
 40
40 -
 41
41 -
 42
42 -
 43
43 -
 44
44 -
 45
45 -
 46
46 -
 47
47 -
 48
48 -
 49
49 -
 50
50 -
 51
51 -
 52
52 -
 53
53 -
 54
54 -
 55
55 -
56
-
57
-
58
-
59
-
60
-
61
-
62
-
63
-
64
-
65
-
66
-
67
-
68
-
69
-
70
-
71
-
72
-
73
-
74
-
75
-
76
-
77
-
78
-
79
-
80
-
81
-
82
-
83
-
84
-
85
-
86
-
87
-
88
-
89
-
90
-
91
-
92
-
93
-
94
-
95
-
96
-
97
-
98
-
99
-
100
-
101
-
102
-
103
-
104
-
105
-
106
-
107
-
108
-
109
-
110
-
111
-
112
-
113
-
114
-
115
-
116
 |
 |

SUNTRUST ANNUAL REPORT 43
plans, included in Note , Employee Benefit Plans, to the Consolidated
Financial Statements. Additional information with respect to the obliga-
tions is presented in tables included in Note , Employee Benefit Plans, to
the Consolidated Financial Statements.
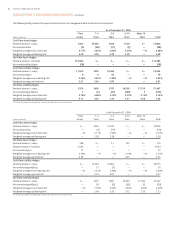
FOURTH QUARTER RESULTS
SunTrust reported net income of . million, or . per diluted share
for the fourth quarter of compared to . million, or . per
diluted share for the fourth quarter of . After-tax merger expense of
. million, or . per diluted share, related to the Company’s acquisi-
tion of NCF on October , was incurred in the fourth quarter of
compared to . million, or . per diluted share, in the fourth quarter
of .
The above mentioned results for the fourth quarter of are dif-
ferent from what the Company reported in its January , earnings
release in which the Company reported net income of . million, or
. per diluted share. The difference of . million equaled .% of
net income for the fourth quarter of . Subsequent to the release of the
Company’s earnings on January , , the Company identified imma-
terial accounting errors related to certain derivative transactions. The mis-
statements related to the Company’s interpretation and application of the
“shortcut” method of hedge accounting under SFAS No. , “Accounting
for Derivative Instruments and Hedging Activities.” The Company deter-
mined that these hedges did not qualify for hedge accounting using the
“shortcut” method. As a result, changes in the market value of the deriva-
tives should have been recorded through noninterest income with no cor-
responding offset to the hedged item. The Company evaluated the impact
of these errors to all quarterly and annual periods since the inception of the
hedges.
The annual impact of these errors to net income for each of the three
years ended December , was .%, .%, and .%, respectively.
The Company does not believe that these errors either positively or nega-
tively affect the Company’s financial trends. The Company concluded that
the impact of these errors was immaterial to all annual and quarterly peri-
ods; however, the Company determined that it was appropriate to record
an adjustment as of December , to correct the cumulative impact
of these errors. The cumulative pre-tax impact of these errors resulted in
additional noninterest income of . million, which is included in trad-
ing account profits and commissions in the Consolidated Statement of
Income.
As of December , , seven derivatives remained outstanding
with a total notional value of . billion. The Company terminated four of
the derivatives in the first quarter of . Two of the derivatives were des-
ignated in the first quarter of as hedges using the “long haul” method
under SFAS No. , and one of the derivatives was classified as a trading
position. The hedged items associated with these derivatives consisted of
an asset and liabilities. Each of these hedged items continues to remain
outstanding.
Net interest income increased . million, or .%. The increase
in net interest income was mainly due to strong earning asset growth. Total
average earning assets increased . billion, or .%, from the fourth
quarter of driven by strong growth in both portfolio loans and loans
held for sale. Core deposit growth has continued to benefit from marketing
efforts. The net interest margin decreased basis points from the fourth
quarter of . The majority of the margin decrease was attributable to
an increase in loans held for sale at compressed spreads due to flatter yield
curve.
The provision for loan losses for the fourth quarter of was .
million, a decrease of . million, or .%, from the fourth quarter
of . Net charge-offs declined . million, or .%, from the fourth
quarter of due to improved credit quality and sustained economic
improvement in the Company’s footprint. The decline in net charge-offs
was primarily related to a . million, or .%, decrease in consumer
net charge-offs from the fourth quarter of .
Noninterest income was . million in the fourth quarter of ,
an increase of . million, or .%, compared to the fourth quarter of
. The increase was primarily attributable to securities losses of .
million incurred in the fourth quarter of compared to securities
gains of . million in the fourth quarter of . Also positively impact-
ing noninterest income were increases in mortgage related income, trust
and investment management income, ATM fees, and card fees; partially
offset by a decline in trading account profits and commissions. Mortgage
related income increased . million, or .%, from the fourth quarter
of due to an increase in mortgage production and mortgage servicing
fees. Trust and investment management income increased . million,
or .%, from the fourth quarter of due primarily to growth in assets
under management, which increased .% from December , . Card
fees increased . million, or .%, from the fourth quarter of due
to higher interchange income on increased debit card transactions. Trading
account profits and commissions decreased . million, or .%, from
the fourth quarter of primarily due to trading losses incurred in the
fourth quarter of due to market conditions.
Noninterest expense in the fourth quarter of was ,. mil-
lion, an increase of . million, or .%, from the fourth quarter of .
Personnel expense, the largest component of noninterest expense, grew
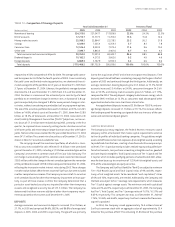
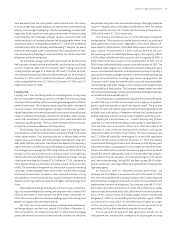
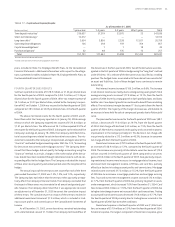
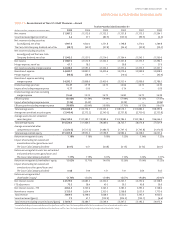
TABLE • Contractual Commitments
As of December ,
(Dollars in millions) year or less – years – years After years Total
Time deposit maturities , , , ,
Short-term borrowings , — — — ,
Long-term debt , , , , ,
Operating lease obligations
Capital lease obligations —
Purchase obligations
Total , , , , ,
Amounts do not include accrued interest.
Includes contracts with a minimum annual payment of million.