SunTrust 2005 Annual Report Download - page 18
Download and view the complete annual report
Please find page 18 of the 2005 SunTrust annual report below. You can navigate through the pages in the report by either clicking on the pages listed below, or by using the keyword search tool below to find specific information within the annual report.-
 1
1 -
2
-
3
-
4
-
5
-
6
-
7
-
 8
8 -
 9
9 -
 10
10 -
 11
11 -
 12
12 -
 13
13 -
 14
14 -
 15
15 -
 16
16 -
 17
17 -
 18
18 -
 19
19 -
 20
20 -
 21
21 -
 22
22 -
 23
23 -
 24
24 -
 25
25 -
 26
26 -
 27
27 -
 28
28 -
29
-
30
-
31
-
32
-
33
-
34
-
35
-
36
-
37
-
38
-
39
-
40
-
41
-
42
-
43
-
44
-
45
-
46
-
47
-
48
-
49
-
50
-
51
-
52
-
53
-
54
-
55
-
56
-
57
-
58
-
59
-
60
-
61
-
62
-
63
-
64
-
65
-
66
-
67
-
68
-
69
-
70
-
71
-
72
-
73
-
74
-
75
-
76
-
77
-
78
-
79
-
80
-
81
-
82
-
83
-
84
-
85
-
86
-
87
-
88
-
89
-
90
-
91
-
92
-
93
-
94
-
95
-
96
-
97
-
98
-
99
-
100
-
101
-
102
-
103
-
104
-
105
-
106
-
107
-
108
-
109
-
110
-
111
-
112
-
113
-
114
-
115
-
116
 |
 |

16 SUNTRUST 2005 ANNUAL REPORT
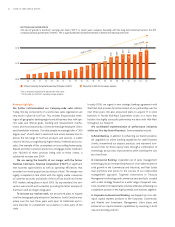
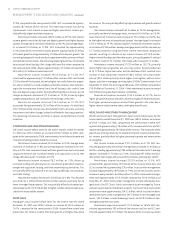
•Revenue Growth – As noted earlier, strong loan and deposit
growth contributed to a healthy gain in net interest income, up
seven percent over 2004. The net interest margin for 2005 was
relatively stable —no small achievement in a challenging
rate environment.
Our sales efforts also produced good noninterest income
growth - up six percent over 2004. Once again, mortgage pro-
duction was a key factor, along with ATM/debit cards and trust
and investment product-related fee income. It all added up to
total core revenue of $7.8 billion, up six percent.
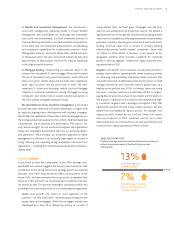
•Expense Discipline – Our strong revenue growth, balanced with
success in holding core expense growth to a reasonable four
percent over 2004, resulted in positive operating leverage in
2005, which in turn led to an improvement in our efficiency ratio
of 146 basis points, or 2.4 percent, over last year. As pleased as
we are with that achievement — and we want to be more
efficient in the future — we would note that there is a limit to how
low this ratio can go at SunTrust. That’s because our business mix
is different from that of our peers in that it emphasizes some
higher-efficiency ratio businesses like Wealth and Investment
Management and Mortgage. We believe operating leverage is a
true barometer of how we are performing in terms of expense dis-
cipline, and our progress in that regard bodes well for the future.
Finally, any discussion of earnings drivers would be incomplete
without reference to credit quality, traditionally an area in which
SunTrust is recognized as an industry leader. Although bank credit
quality tends to mirror the economy, SunTrust is typically “best in
class” in virtually all key measures of credit quality regardless of the
point in the economic cycle. That was surely the case in 2005 as our
loan mix shifted toward lower risk categories such as residential real
estate and home equity loans. Net charge-offs declined for the third
consecutive year and, although there can always be surprises in this
area, credit quality measures for both consumer and commercial
loans looked good as 2006 began.
Seeing Beyond Money
In our view what it all boils down to, at the mid-way point of a
turbulent decade for our industry, is this: SunTrust enjoys a particularly
enviable position among large U.S. banking organizations.
We are concentrated in the most attractive banking markets
in the United States. We are in the right businesses, with proven
growth strategies. We have the financial resources, product scope
and technology platform we need to compete effectively. And, not
incidentally, we have some of the most talented, most motivated
people in the business.
We also, as demonstrated again in 2005, can point to a track
record of performance that shows how it all comes together.
We are committed to building on our success and delivering
results that further validate the merits of “Seeing beyond money” as
we serve the interests of our clients, our communities, our employees
and, of course, our shareholders.
Thank you for your interest in SunTrust.
L. Phillip Humann
Chairman and Chief Executive Officer
James M. Wells III
President and Chief Operating Officer
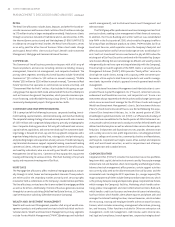
6%
Core Revenue
Growth1
4%
Core Expense
Growth2
IMPROVING EFFICIENCY
A concerted effort to improve operating leverage shows results as
2005 revenues grew at a faster rate than expenses.
1SunTrust presents total revenue excluding realized securities gains/losses
and the net gain on sale of factoring assets for 2005.
2Core expense growth excludes merger related expenses, amortization of
intangibles and impairment charge on Affordable Housing Properties.
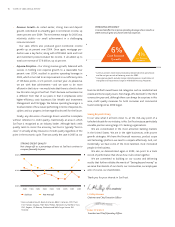
4Q03
0.00%
0.30%
0.60%
1Q04 2Q04 3Q04 4Q04 1Q05 2Q05 3Q05 4Q05
SunTrust Peer Average1
1Peers include AmSouth, Bank of America, BB&T, Comerica, Fifth Third,
First Horizon, Keycorp, M&T Bank, Mellon, National City, Northern Trust,
PNC, Regions, US Bancorp, Wachovia and Wells Fargo. Source: SNL
Financial
STRONG CREDIT QUALITY
Net charge-offs as a percentage of loans at SunTrust continue to
compare favorably to peers